
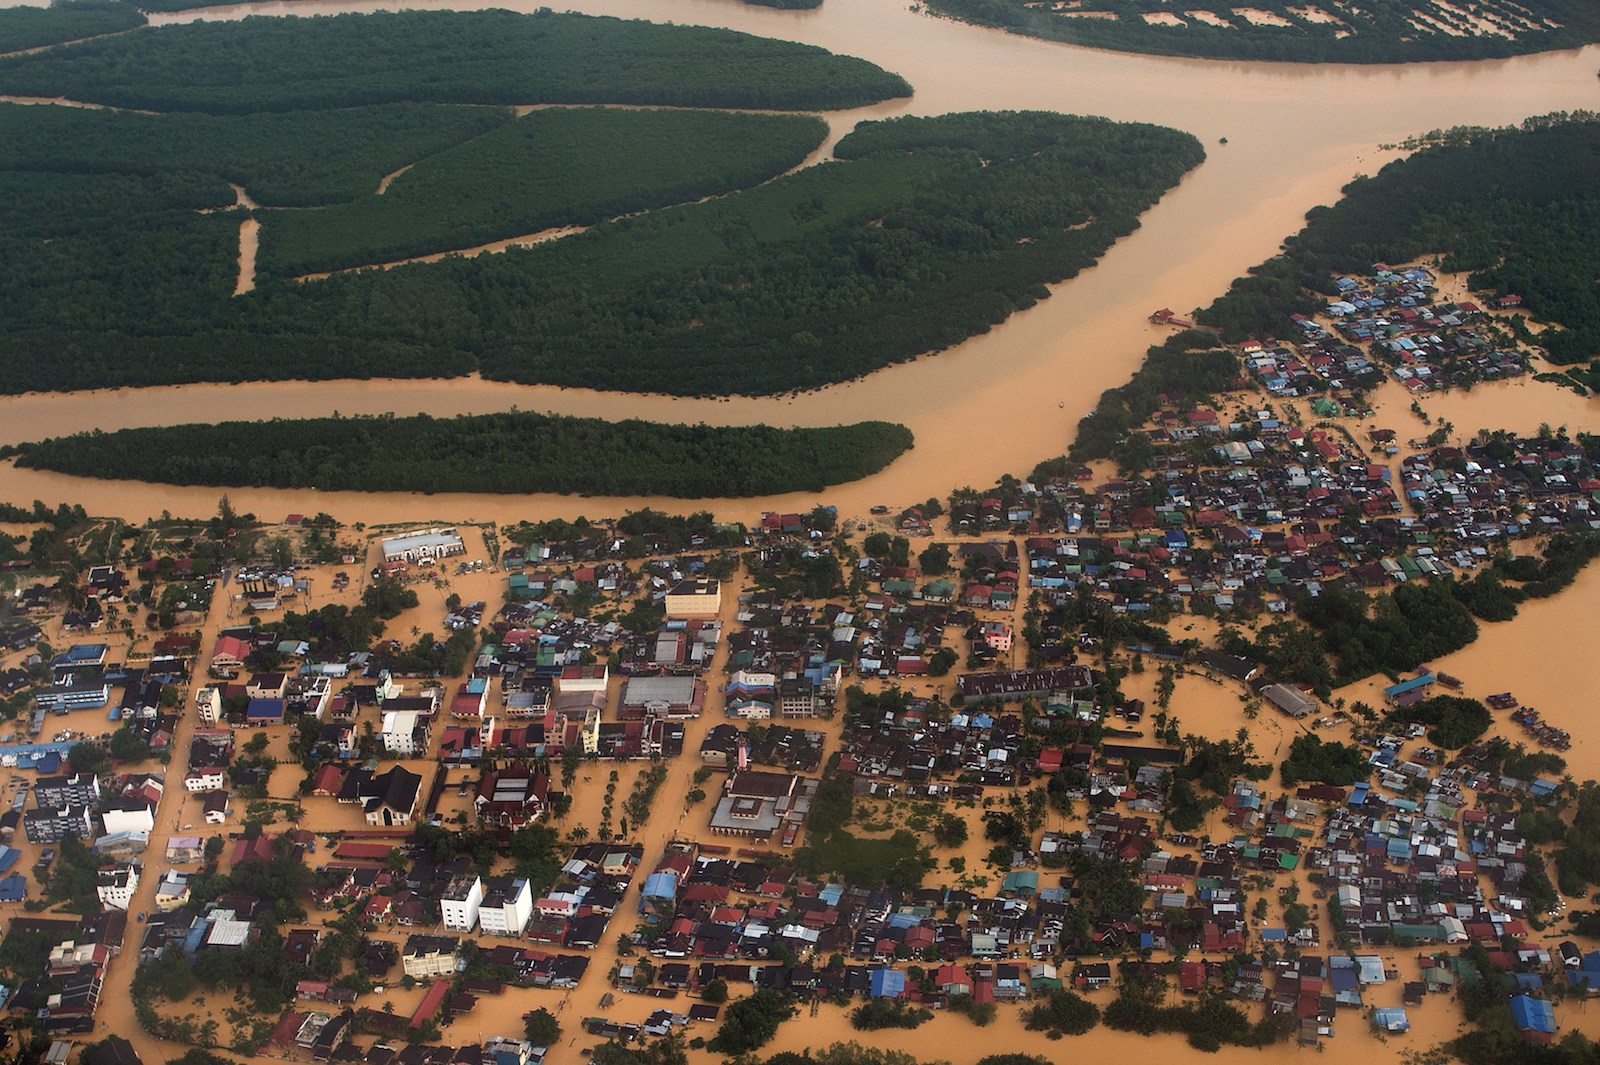
Houses and plantations submerged in floodwaters in Pengkalan Chepa, near Kota Bharu in Malaysia on December 27, 2014. Flooding is the most expensive natural disaster in the country.
Photo: Mohd Rasfan/AFP/Getty Images
In mid-December 2014, heavy rains brought by the Northeast Monsoon started to batter vast stretches of Peninsular Malaysia. Precipitation persisted until the first days of 2015, and accumulated rainfall in some areas exceeded 1,750 mm, up to six times the amount usually observed in December.
When flood waters finally started to recede in early January, the extent of the damage became evident. Over 230,000 people had been evacuated from their homes across five states, and 21 people were killed. According to the International Federation of Red Cross and Red Crescent Societies, between 500,000 and 1 million people were affected by the event. Economic losses were in excess of $280 million, and insurance information provider Axco estimated insured losses to be around $63 million. The most affected states were Pahang, Terengganu and Kelantan, where floods ravaged about 184,000 hectares of palm plantations and crippled palm oil production, a vital sector of the Malaysian economy.
The December 2014 – January 2015 flood, described as one of the worst in the last decades, followed a long series of analogous events hitting various areas of the country. In December 2006 and January 2007, Johor and Kelantan were ravaged by extensive flooding, and economic losses amounted to about $420 million.
More recently, in January and February 2018, the states of Pahang, Johor, Terengganu and Sarawak were hit by another event, and in November 2018 a flash flood caused disruption in parts of Kuala Lumpur. Malaysia has a long history of devastating flood events, and one of the worst episodes on record is the Great Flood of 1926, when adverse weather conditions—worsened by man-made environmental changes and poor hydraulic management—caused substantial damage across a vast area, including Kuala Lumpur and stretches of the Klang River Valley.
According to Malaysia’s Department of Irrigation and Drainage, the many rivers running through the country put about 9 percent of the total land area under flood risk, potentially affecting 2.7 million people. Rapid urbanization is only going to worsen the problem through rising population concentrations and at-risk infrastructure, land consumption and the channeling of water courses. Despite substantial funding deployed in the last decades to support flood mitigation projects across Malaysia and efforts to devise innovative solutions, such as the Stormwater Management and Road Tunnel, flooding still occurs frequently, especially during the northeast monsoon season (October to March).
Analytical Tools To Quantify Flood Risk
Quantifying the threats posed by flooding is essential to manage the financial consequences. Information on past events is useful in understanding the peril and can be compiled to identify flood-prone locations by creating hazard maps.
Such maps, often having limited geographical coverage, provide an immediate impression of floodable areas at different return periods, for example, showing the water extent around a river basin associated to an event having an expected recurrence of 100 years. The limited historical record and the paucity of reliable data, however, do not typically allow for a comprehensive view on the peril.
Despite being a useful risk assessment tool, flood hazard maps often lack essential information on event severity, such as water depth, and at best, offer an oversimplified representation of flooding frequency.
As a much more sophisticated alternative for risk assessment, catastrophe models have become an integral part of the insurance and reinsurance industry since their introduction in the 1980s. They are also used routinely to estimate losses that could be sustained if a catastrophic event were to occur.
Understanding Flood Modeling
Virtually all catastrophe models are based on three fundamental components: hazard, vulnerability and financial impact. The hazard component describes the full range of risk by incorporating information on thousands of possible events simulated by extrapolating data from historical observations.
The vulnerability component accounts for the physical damage caused by each event on structures, their contents and business operations. The financial component calculates the monetary losses accrued from physical damage and business interruption, incorporating information on the insurance and reinsurance conditions on the affected assets.
The hazard component of a flood model is typically created by making use of historical observations of precipitation, temperature and river discharges. In addition to causing river water levels to rise, rainfall can lead to soil saturation, exacerbating the impact of flooding, while in some regions, high temperatures have the potential of causing excessive ice and snowmelt, increasing the amount of water in rivers and eventually producing inundation.
These processes should be accounted for when generating the hazard component. Riverine (fluvial) flooding events are created by adopting hydrological and hydraulic modeling techniques, which make use of climatological data to realistically simulate water flows across the river network and overflowing when basins fill beyond their natural capacity. Flooding, however, can also occur away from water bodies due to a heavy downpour saturating the soil and drainage systems, especially in heavily urbanized areas. Such rainfall-induced (pluvial) flooding can be realistically simulated if reliable information on local climatic conditions is used in conjunction with land use data.
To offer a realistic representation of both fluvial and pluvial flooding in terms of water extent and depth, information on terrain elevation is also required. A key component of hydrological simulations, digital elevation model data sets offer a three-dimensional representation of terrain surface and are typically generated from remote sensing measurements.
Exhibit: Heavy Monsoon Rainfall Between December 7 and December 13, 2004
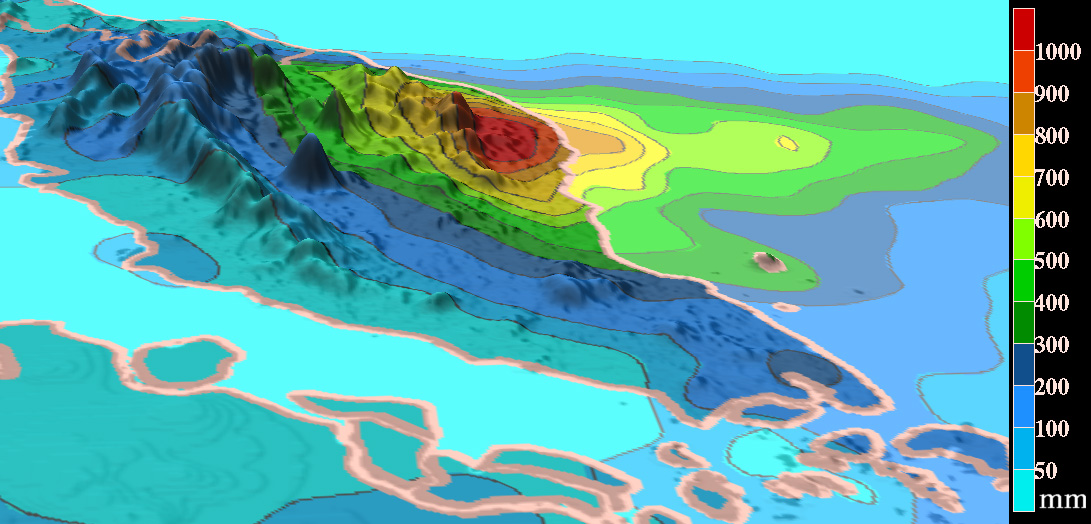
Heavy monsoon rainfall between December 7 and December 13, 2004, overlaid on a digital elevation model showing the topography of the Malaysian Peninsula.
Source: Monsoon Rains Flood Malaysia, NASA’s Earth Observatory
The core of the vulnerability component is a set of damage functions linking flood depth to damage for a wide range of risk types. This relationship typically varies depending on a number of criteria, including asset type, building materials and construction codes. Damage functions can be created by collecting information on claims and by estimating the structural response of buildings to flooding.
After the vulnerability component estimates the economic losses associated to all the events in the hazard component, the financial component computes the monetary losses incurred by the insurer, accounting for the insurance and reinsurance policy conditions. By simulating the full spectrum of all possible flood events, the model is able to provide users with useful information on their insurance portfolios, such as average annual losses and the annual probability of occurrence of a loss greater than a given amount.
Managing Flood Risk
Among all natural perils, floods represent one of the main drivers of losses worldwide. A wide gap is still present in the market, with very few models available to estimate the financial impact of flooding. Malaysia is one of the most urbanized countries in Southeast Asia, and the increasing concentration of population and assets, together with an equatorial climate and the presence of two monsoon seasons, make flooding the most expensive natural disaster in the country.
Advanced analytics capabilities from the insurance and reinsurance industry in coordination with mitigation and adaptation policies are essential to better understand and manage flood risk.