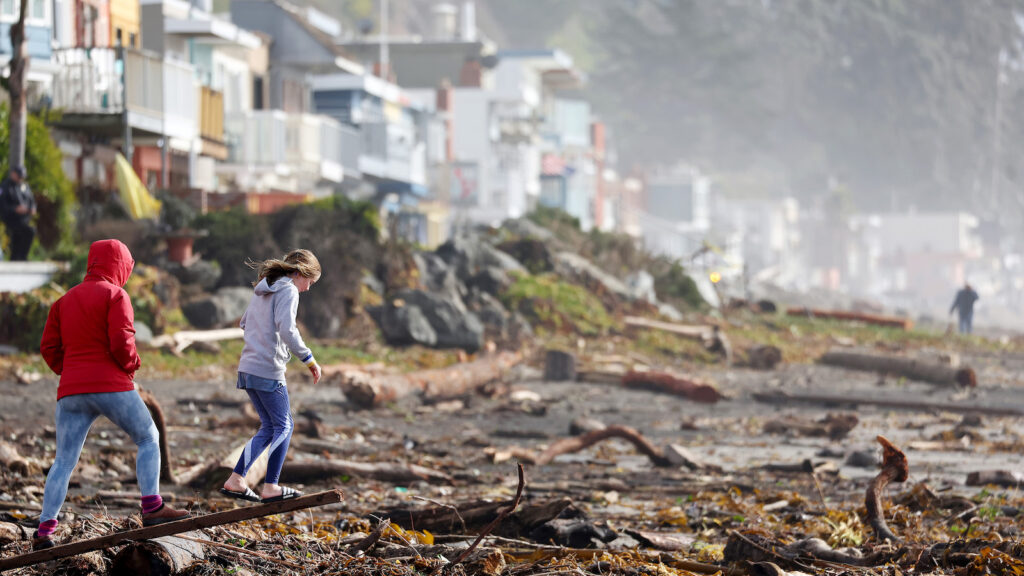
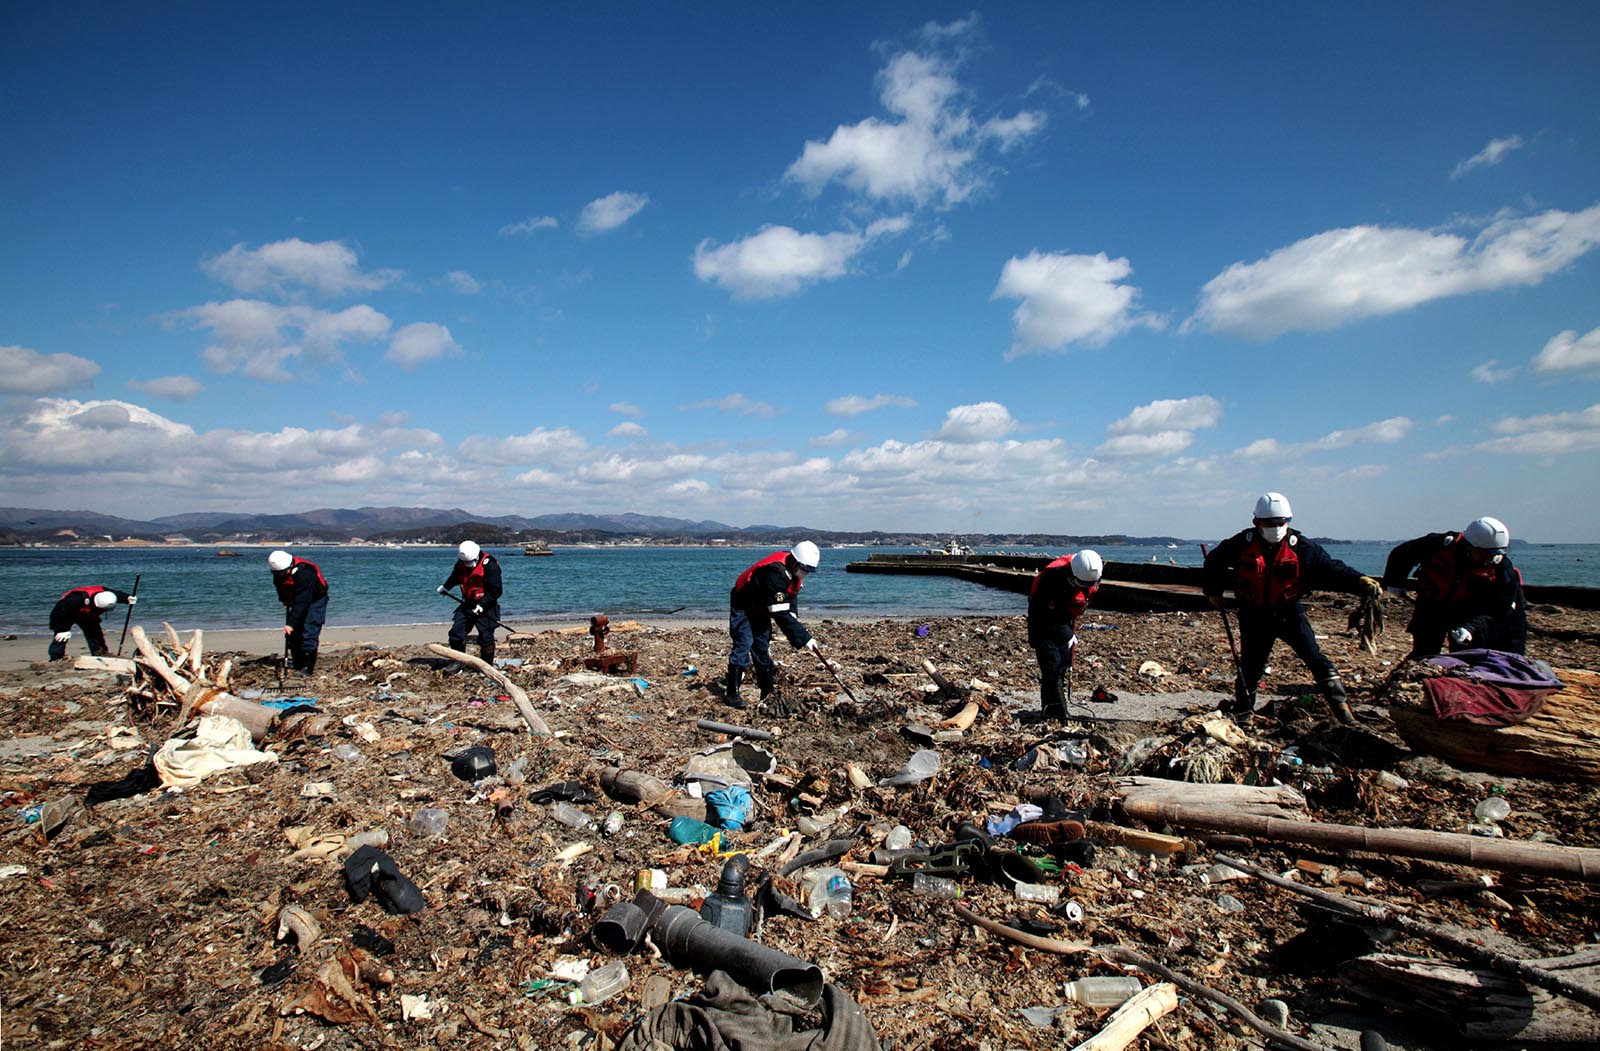
Police officers search for remains of victims of the massive earthquake and tsunami which hit northeastern Japan in 2011.
Photo: Jiji Press/AFP/Getty Images
Recent loss activity has impacted the demand for insurance, particularly for coverage of natural catastrophes that would require homeowners insurance, commercial and industrial property insurance, and agriculture insurance.
Since natural perils such as earthquakes are infrequent, the perception of their risks is likely to reduce during a prolonged period of inactivity, along with the perception of the need to insure against them. However, after large-scale events, people and governments are reminded of the potential impacts of a natural catastrophe, which increases the desire to be prepared against future catastrophes.
For example, in Japan, the nonlife insurance companies provide the original policies for residential earthquake coverage and then reinsure 100 percent of this business to the Japan Earthquake Reinsurance (JER) Company. The two prefectures with the most damage from the Tohoku earthquake, Miyagi and Fukushima, have shown sharp increases in the earthquake takeup rates with the JER in the years after the Tohoku earthquake, showing increased demand for insurance after this event. The takeup rates refer to the total number of active policies with the JER at the end of the year divided by the number of households in the prefecture.
Exhibit 1: Residential Earthquake Insurance Takeup Rates in Japan with the JER
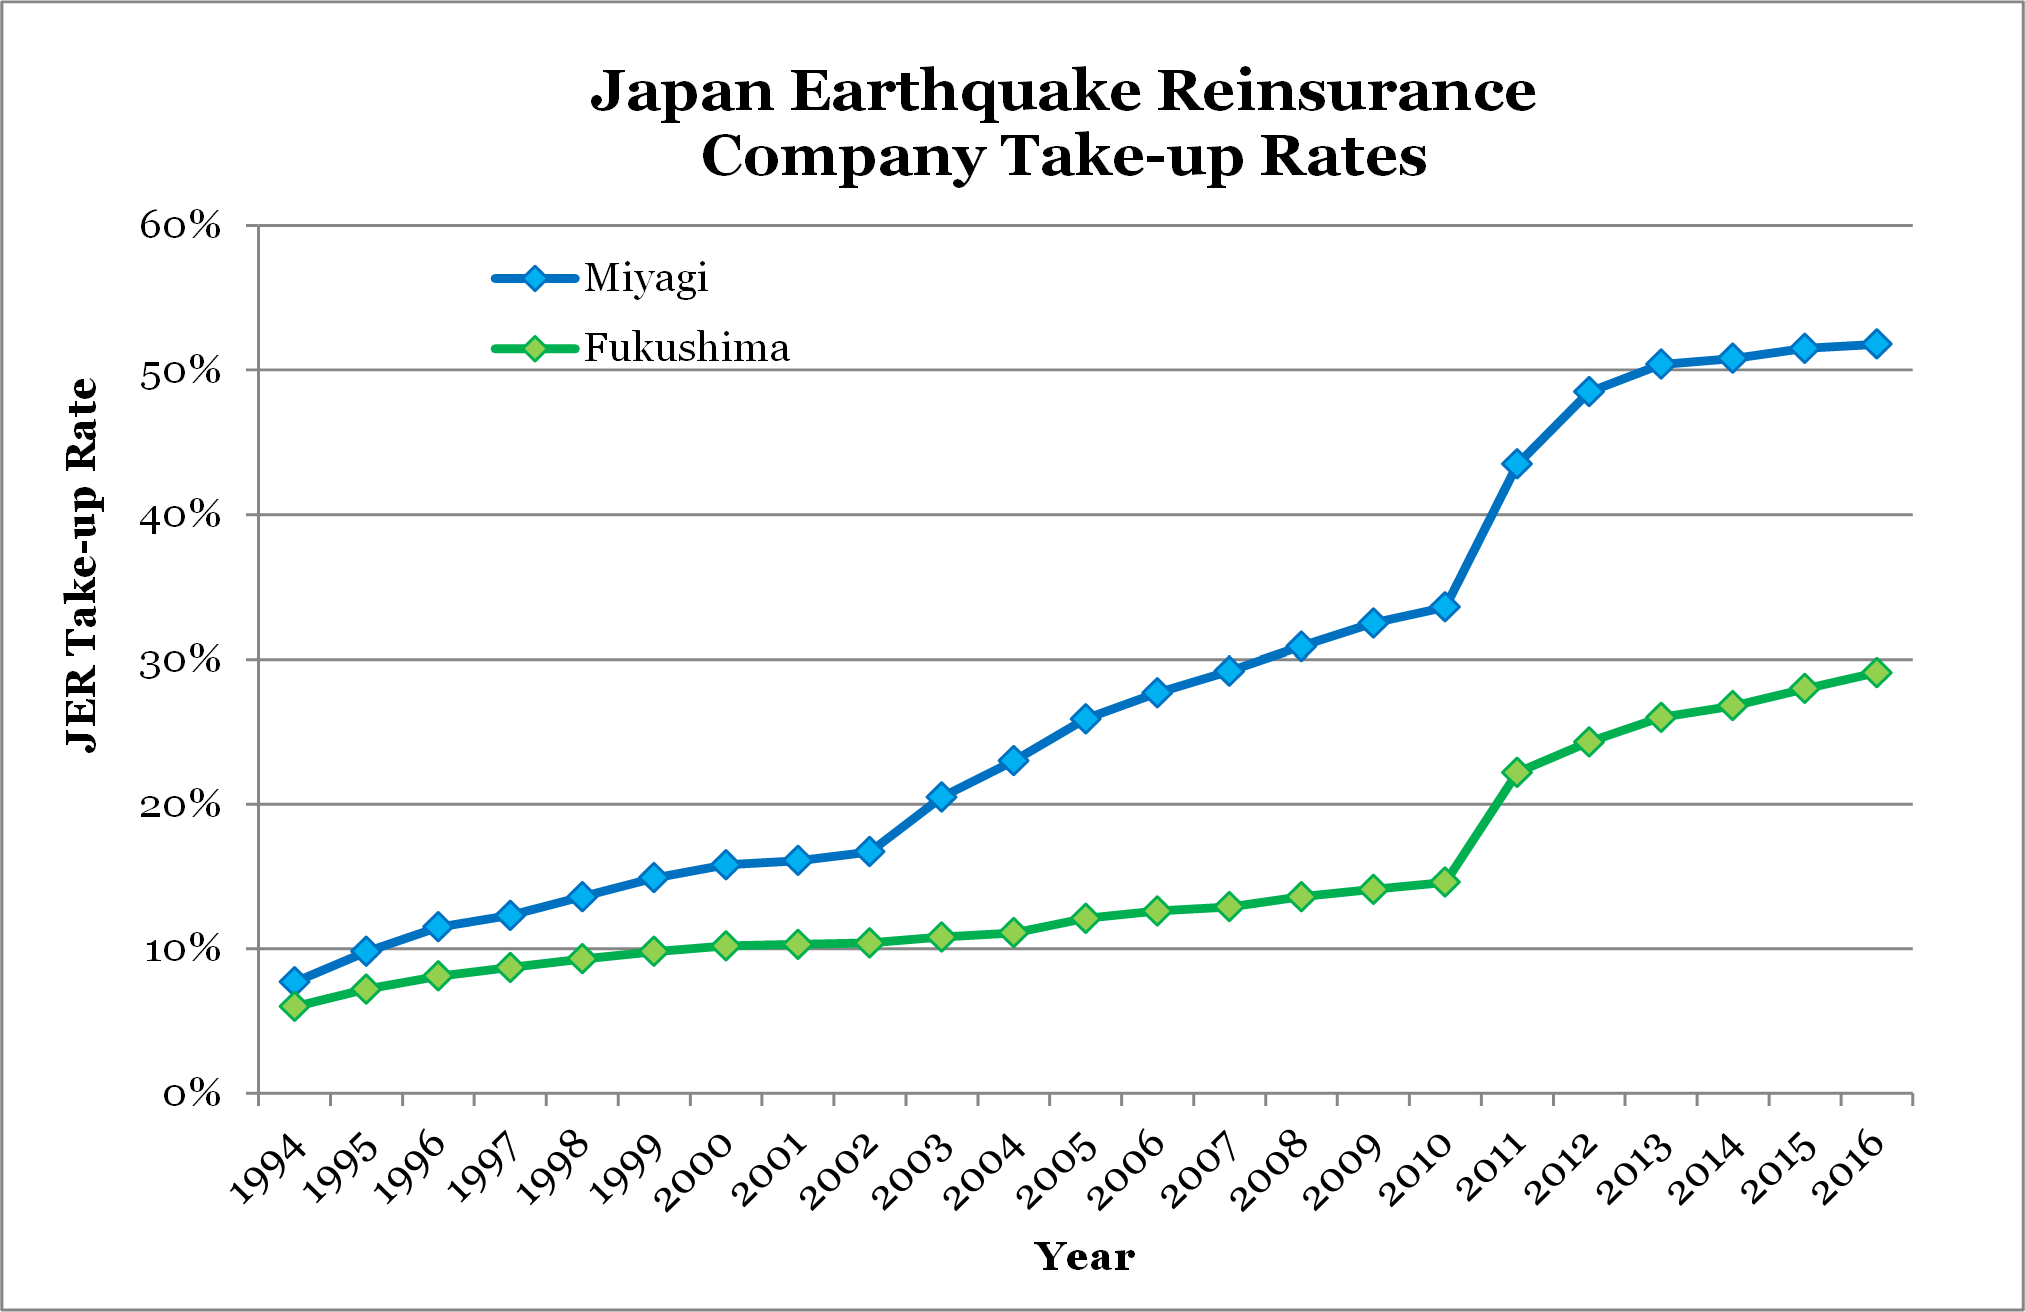
Source: General Insurance Association of Japan
While large catastrophes can increase the demand for insurance, they can also impact the supply of insurance. Due to the potential widespread destruction from natural catastrophe, insurance companies are unlikely to provide coverage because the aggregate risk is viewed as too large, or the price at which insurers are willing to provide coverage is viewed as too high by potential customers. When this happens, governments may get involved to help provide a solution, and this typically occurs after large events.
For example, in Japan, a special law concerning earthquake insurance was enacted in 1966 following the Niigata earthquake of 1964. In 1999, the 7.3 magnitude earthquake that struck Nantou County in central Taiwan prompted the government to set up an earthquake insurance pool system resulting in the formation of the Taiwan Residential Earthquake Insurance Fund.
The Cost of Reinsurance
For insurance companies that provide coverage for natural perils, there is the potential that the insured losses from a single catastrophe are more than the company is willing or able to pay. To reduce this risk, insurance companies can transfer a portion of the losses to other companies that are called reinsurers. Typically, the reinsurers will either agree to pay a percentage of the losses in return for a percentage of the premium, or the reinsurers will arrange to pay losses above some level and subject to a fixed limit per event. In the later example, the ratio of the cost of the reinsurance as a percentage of the limit provided is referred to as the rate-on-line (ROL).
While large catastrophes can increase the demand for insurance, they can also impact the supply of insurance.
Guy Carpenter has been tracking the aggregate reinsurance limit purchased in each country and the aggregate premium paid and used this to create a ROL index. It is not necessarily a true rate change index, which would require comparing only reinsurance contracts where the loss potential from year to year is roughly the same.
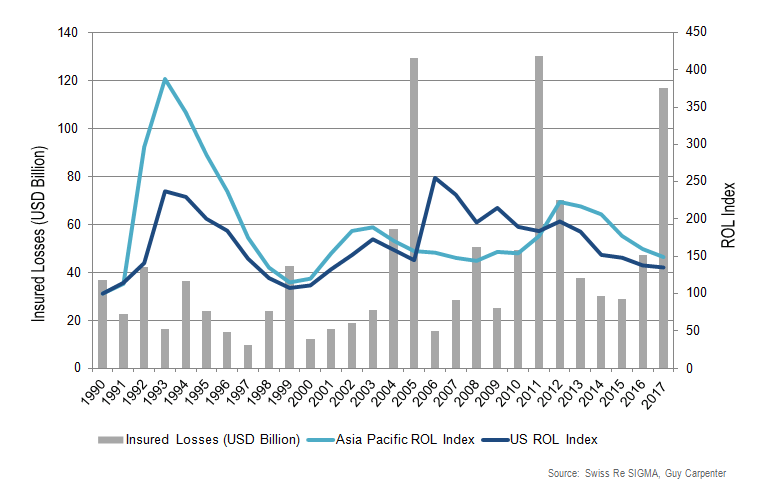
Below is the ROL index in Asia-Pacific and the U.S. along with the historical catastrophe losses. The chart illustrates that the cost of reinsurance typically increases after large reinsurance losses, as reinsurers look to recoup some of the past losses. The largest loss years are 2005, 2011 and 2017. The 2005 losses came mostly from the U.S. as a result of hurricanes Katrina, Rita and Wilma. The 2011 losses are mostly from Asia-Pacific as a result of the Christchurch earthquake, the Tohoku earthquake and the flooding in Thailand.
The ROL indexes show large increases in the U.S. in 2006 after the events of 2005, while the ROL index in Asia-Pacific shows increases in 2011 and 2012, after the events that occurred early in 2011. Some of the reinsurance contracts renewed in the middle of 2011, while others renewed in early 2012, so increases are seen over both these years. The increase in the U.S. and Asia in 1992 and 1993 is primarily the result of Typhoon Mireille in Japan in 1991 and Hurricane Andrew in the U.S. in 1992.
Exhibit 2: Nonlife Catastrophe Loss and ROL Index
The 2017 global catastrophe losses are in line with 2005 and 2011, with the majority of the 2017 losses coming from North America as a result of Hurricane Harvey, Irma and Maria. The initial catastrophe reinsurance rate increases observed during the January 1, 2018, renewal process have been flat to 5 percent for treaties in Asia.
The Growing Insurance Gap
The gap between uninsured and insured risk continues to be an issue in Asia-Pacific as the insurance and reinsurance penetration rates remain low in many Asian countries. The catastrophe reinsurance limit purchased in Asia-Pacific has approximately doubled in the past 12 years, corresponding to an annual growth rate of about 6 percent. However, GDP in Asia-Pacific has experienced an even larger average annual growth rate of 7.7 percent during the same time period, with countries such as China and Indonesia having experienced double-digit GDP growth.
While the purchase in catastrophe reinsurance limit has grown, a majority of the growth is in countries with the highest levels of protection already in place. In simple terms, a comparison of catastrophe reinsurance limits with country GDP reveals that New Zealand, Australia and Japan enjoy the greatest level of protection at 2.6 percent, 1.5 percent and 0.75 percent of GDP, respectively. For India and China, these figures are 0.16 percent and 0.03 percent, respectively, showing a significant protection gap. The number for the U.S. is just over 0.5 percent. If China bought cover at the same level as the U.S., the total catastrophe limit for the territory would increase about 20 times from its current level.
The insurance and reinsurance gap is likely to decrease as economies in developing countries grow and as individuals acquire more assets and have more disposable income to insure their assets. However, it may also require some government involvement and potentially making insurance compulsory.
Part one of this article looked at the recent large-scale catastrophes in Asia-Pacific and at the insurance gap.