
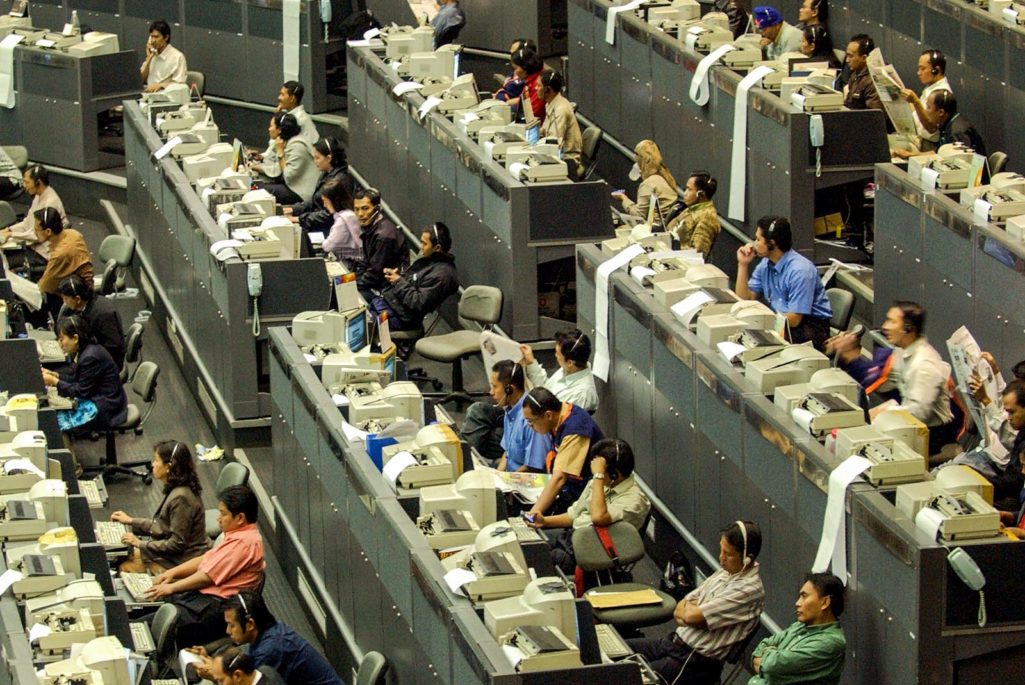
Employees work at the floor of the Jakarta Stock Exchange during a trading session in Jakarta, Indonesia. The Jakarta Stock Exchange composite index had hit 742.943 points on July 9, 1997, before closing the day at 740 points just as the Asian financial crisis of 1997-98 began to unfold.
Photo: Adek Berry/AFP/Getty Images
The breathtaking severity and extent of the Asian financial crisis of 1997, which started with the devaluation of the Thai baht in July, is a chilling memory for many. By June 1998, the Indonesian rupiah had lost 85 percent of its value against the dollar. Even more surprising was the volatility in the markets—for instance, in December 1998, the Korean won lost 45 percent of its value against the dollar, but the sum of the absolute percentage daily changes in that month totaled 145 percent. Elsewhere, the Hong Kong dollar’s peg was attacked in August 1998, and Malaysia ended up imposing draconian capital controls in September.
A comparison of Asian economies in 1996 and 2016 reveals differences, but also some similarities between then and now—and a few new unknowns.
Differences
Data quality. Compared to today, in 1996-97 foreign exchange reserves data was released with long lags, and many countries lacked comprehensive external debt data that, along with credit rating downgrades, probably contributed to many investors assuming the worst.
Exchange rate regimes. Before the Asian crisis, most countries had fixed or heavily managed currencies against the dollar, causing real effective exchange rates to appreciate significantly above trend. This also incentivized borrowings in foreign currency, as pegged exchange rates were viewed as implicit guarantees of exchange value. Today, barring the Hong Kong dollar, exchange rates are much more flexible.
Balance of payments. In 1996, most countries had sizable current account deficits because of overvalued currencies and loose domestic policies. To finance these deficits, before the crisis, many countries had large net capital inflows—larger than those in recent years. However, gross inflows are also useful to monitor, as it is often foreign investors that are more likely to repatriate their investments, and here the picture is more mixed, with several countries (India, Indonesia, Malaysia, Singapore and Taiwan) recently experiencing larger inflows. Yet overall, Asia today has a much stronger balance of payments position, with eight of the 10* countries running current account surpluses, combined with a massive buildup of foreign exchange reserves and a web of central bank currency-swap arrangements.
Global backdrop. Compared to today, the global economic backdrop was much stronger before the Asian crisis—world output grew by 4.0 percent in 1997, the fastest in nine years—which helps explain the export-led V-shaped economic recovery in Asia in 1999. Also, the U.S. Federal Reserve was on hold in 1997 as opposed to its current rate-hiking cycle.
Room for monetary policy to maneuver. In 1997-98, Asian monetary authorities had to raise rates to punitive levels to defend their currencies, causing domestic demand to collapse. Today, with more flexible exchange rates and robust balance of payments, having to raise rates in the face of a financial crisis seems unlikely. That said, interest rates are much lower today than in 1996, leaving central banks little room to cut rates in the face of a domestic credit crunch. One big difference is that in the past decade, Asia has built up large macroprudential buffers—such as lowering property loan-to-value ratios or raising stamp duties on property transactions.
Similarities
Limited government debt. Government debt in the region is currently highest in India (70 percent of GDP), and it is noticeably higher—compared to debt in 1996—in China, Malaysia, Korea, Taiwan and Thailand. Asian governments have taken on more debt than before the Asian crisis—the simple average of the debt ratios in the region was 44 percent of GDP in 2016 versus 31 percent in 1996. But this is still quite a low ratio, particularly in a global context (G20 public debt averaged 114 percent of GDP in 2016), leaving much space for emergency fiscal stimulus.
Asia is not insulated from global monetary policy normalization, global protectionist sentiments, and other risks.
External debt exposure. The simple average of external debt in GDP for the region was 32 percent in 2016, a little lower than in 1996. The share of short-term, unhedged foreign-currency debt is also lower now than 20 years ago (this was Asia’s Achilles’ heel in 1997, as massive currency devaluations greatly inflated external debt; Indonesia’s external debt rose to 155 percent of GDP in 1998 from 28 percent in 1996). That said, the degree of exposure doesn’t provide a full picture as external debt data does not capture the relatively new phenomenon of offshore subsidiaries of Asian companies raising cheap U.S. dollar funding, which is not easy to measure.
High private credit. As before 1997, private credit levels are high; in six of the 10 countries the ratios to GDP are higher than in 1996, most notably in China (211 percent versus 90 percent in 1996). The deviation of this credit ratio from long-run trend (the credit gap) and the private (household and corporate) debt-service ratio, both useful early warning indicators of past financial crises, are now high in many countries.
Property market froth. Studies of past financial crises show that they are more likely to occur when there are parallel credit and property market booms. As in 1996, this is the case in several Asian countries today. Our measure of property market froth—real (CPI adjusted) property price deviation from its long-run trend (property gap)—is high, most notably in China, but also in Hong Kong, Indonesia, Malaysia, the Philippines and Thailand.
New Unknowns
Quantitative “tightening.” Asia has become used to very low interest rates since 2008, as quantitative easing (QE) in the developed markets set off a global hunt for yield. As many central banks contemplate unwinding QE, a snapback in developed market bond yields cannot be ruled out. This could be the trigger for a fundamental re-pricing of emerging market credit risk, to which Asia seems vulnerable. Strikingly, in all Asian countries debt-service ratios are now higher than in 2007, even though policy interest rates are lower.
Market liquidity illusion. Liquidity could evaporate quickly, causing Asian credit spreads to widen sharply. For example, this could happen if the world’s giant asset managers reassess the risk-return trade-off on their investments in Asia’s relatively small debt markets en masse.
China, to which the rest of Asia is very exposed, is flashing several signs of vulnerability. Whether China is willing to tolerate some short-term pain for long-term gain, by persevering with deleveraging, closing zombie companies and letting markets play a more decisive role, remains to be seen. The longer China delays, the bigger the risk of disruptive adjustments, from which the contagion to the rest of Asia could be substantial.
Protectionism. Amid high U.S. policy uncertainty, an escalation in trade protectionism against China could quickly spread across the region’s value chains, hurting trade and lifting inflation. A trade war or foreign-policy-related tensions could also trigger a disorderly unwind of Asia’s financial cycle.
In summary, although Asia has a much stronger balance of payments position than it did 20 years ago, we should not deceive ourselves into believing the region is insulated from global monetary policy normalization and other risks. Claudio Borio, head of the Economic Department at the Bank for International Settlements, reminds us that some of the most spectacular financial crises in history have occurred in countries with current account surpluses—think of the bursting of Japan’s 1980s asset bubble and of the U.S. ahead of the Great Depression.
To this end, our early warning indicator (EWI) model—which has reliably signaled at least two-thirds of the past 50 financial crises in 30 countries since the early 1990s—is signaling that Asia is the region most at risk, with 180 flashing EWIs versus 220 in 1996. Asia has been flying at cruising altitude in the first half of 2017, but prepare for at least some turbulence in the next 18 months.
*The 10 countries include China, Hong Kong, India, Indonesia, Malaysia, Philippines, Singapore, South Korea, Taiwan and Thailand. A table comparing their economic indicators from 1996 and 2016 is provided below for more information.
(Click on chart below for larger view.)
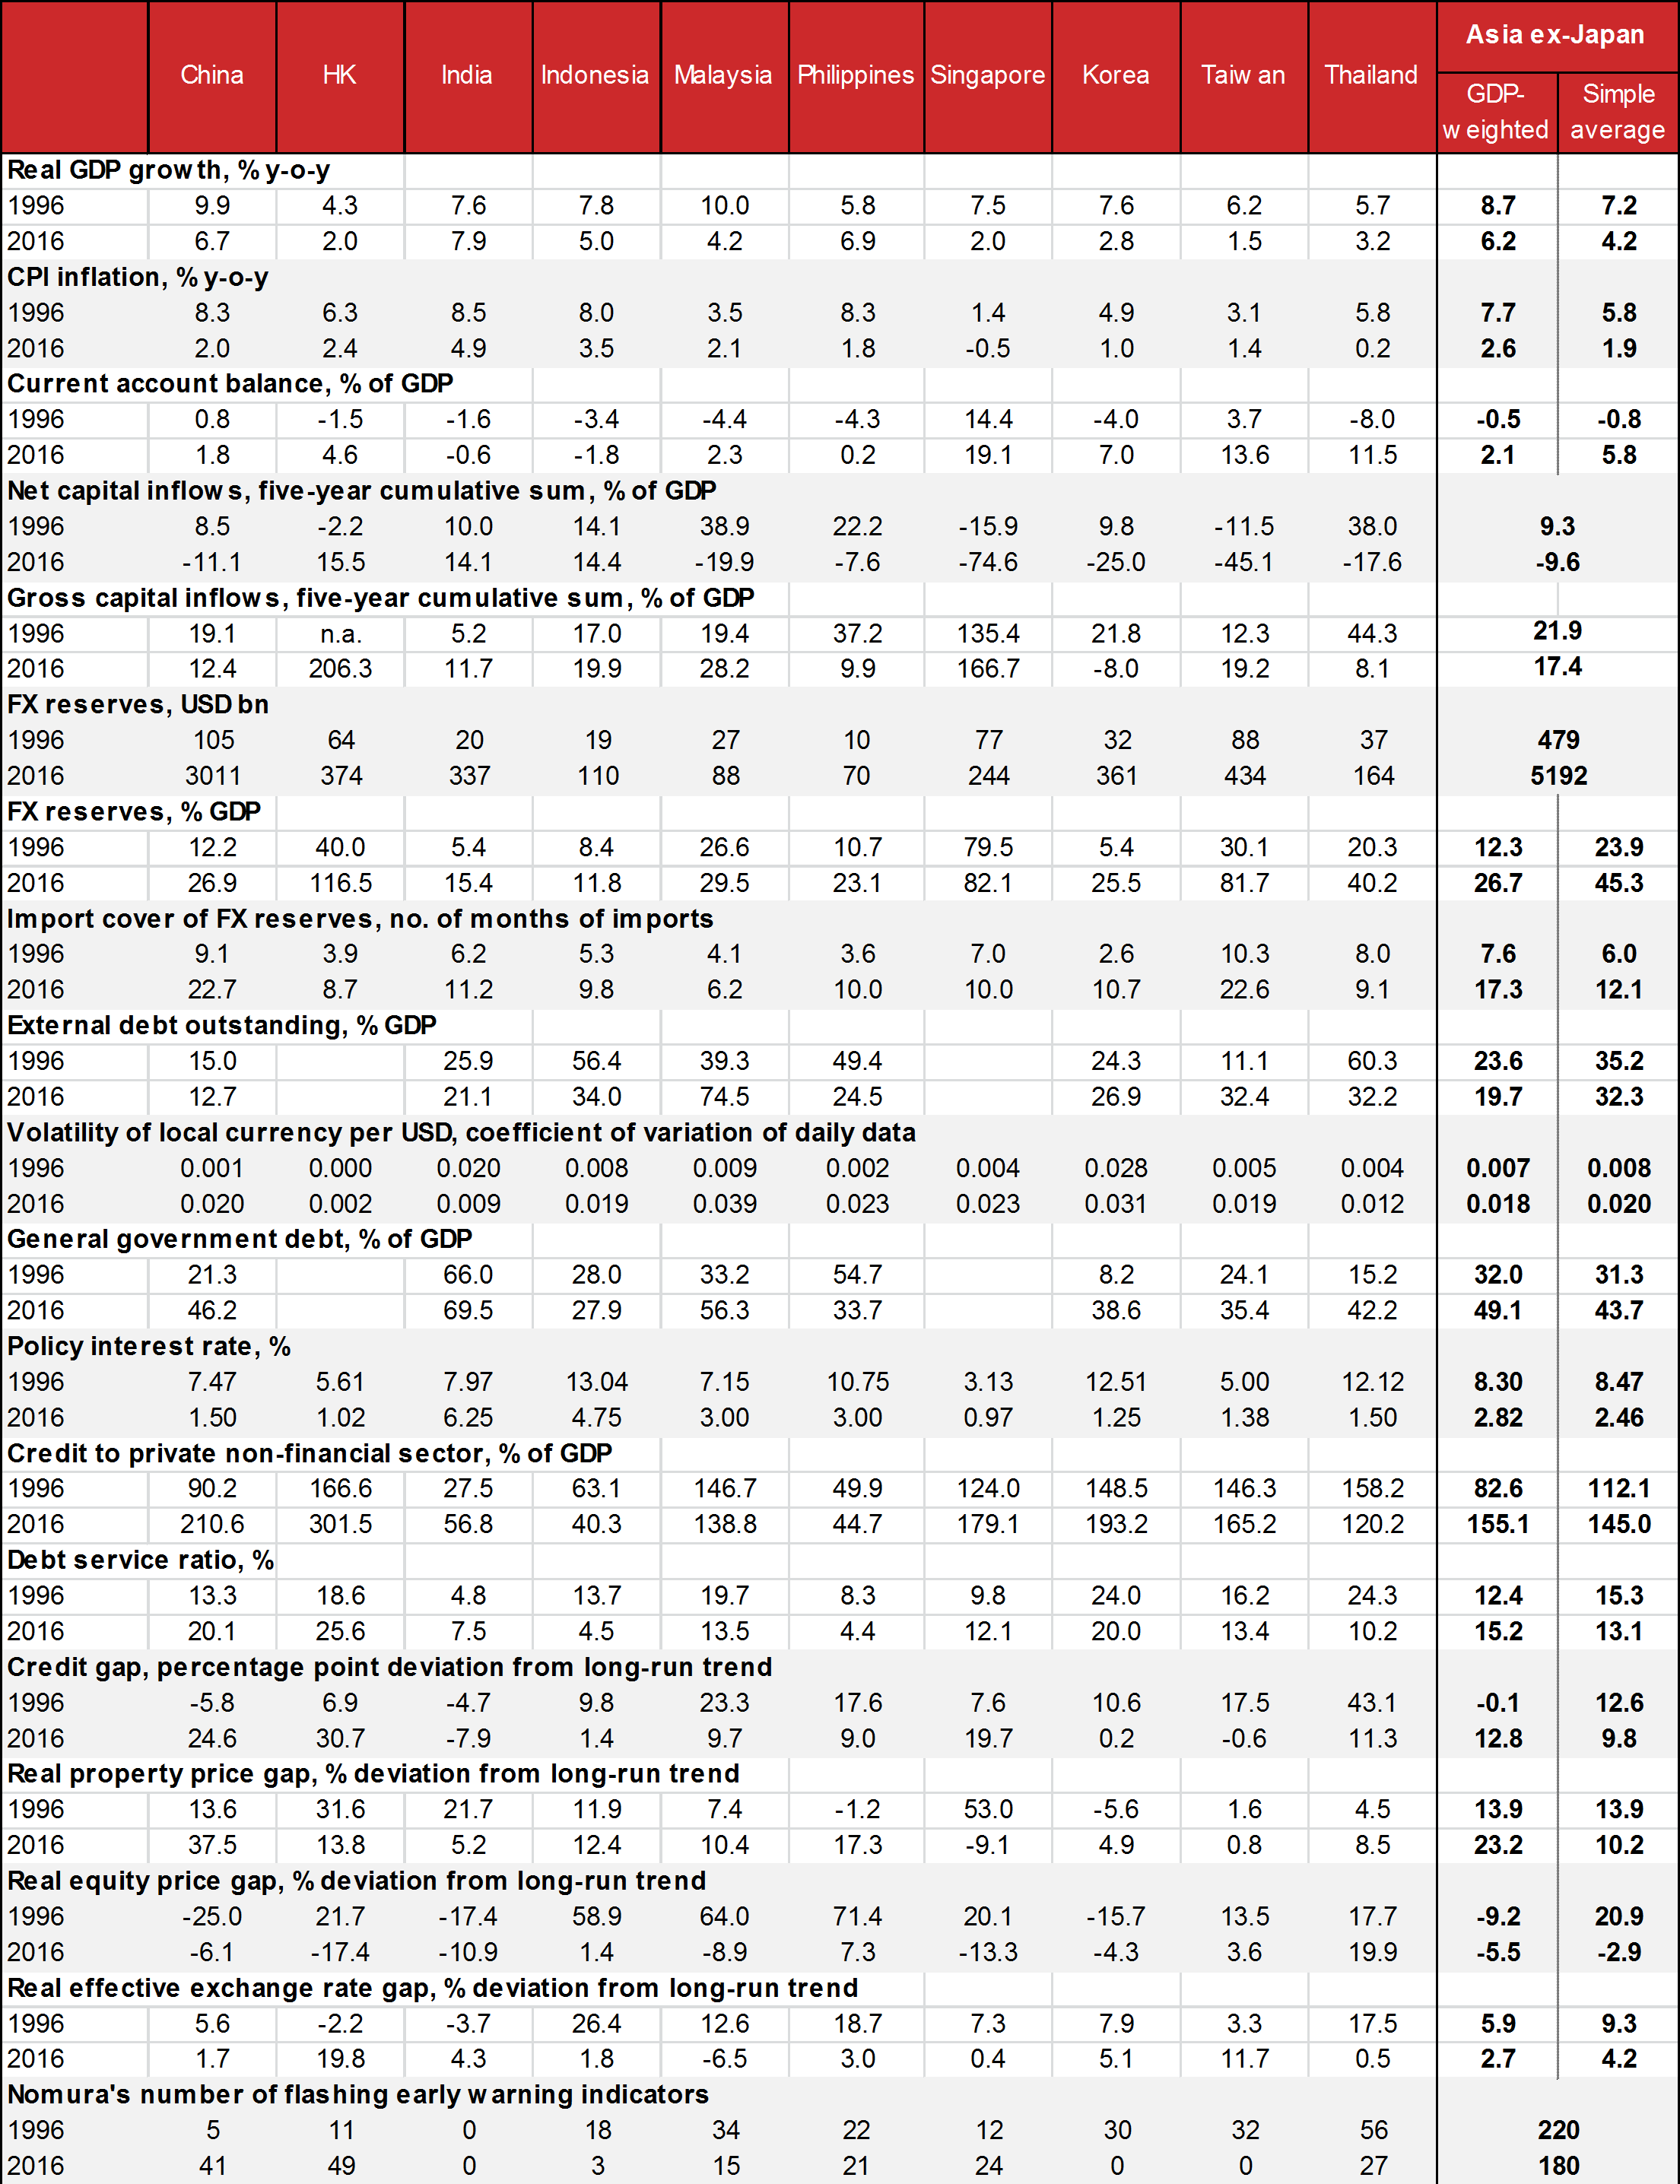
Note: The columns under Asia ex-Japan contain the GDP-weighted average and simple average of the 10 countries in the table for all variables except FX reserves and number of flashing early warning indicators (sum of FX reserves or early warning indicators of 10 countries), and net and gross capital inflows (total net or gross capital inflows into the 10 countries in the table, divided by total nominal GDP of the countries in 1996 or 2016). Net or gross capital inflows into a country are the 5-year cumulative sum of capital inflows to 1996 or 2016, divided by 1996 or 2016 nominal GDP of the country. External debt is excluded for Hong Kong and Singapore because they are largely trade-finance related. Gross general government debt is excluded for Hong Kong and Singapore because issuances of government bonds are not used to finance spending. Gaps (for credit, property, equity and REER) are the percentage or percentage point deviation of the actual end- 1996 or 2016 data from a long run Hodrick Prescott filtered trend. Number of flashing early warning indicators refers to the number of signals given out for a particular country in 1996 or 2016, that warns of an impending financial crisis for that country (see Asia’s maturing financial cycle, 19 July 2016). For policy interest rates, we use the 3m SIBOR and HIBOR rate for Singapore and Hong Kong, respectively. Year-end values (Q4) are shown for FX reserves, import cover, external debt, general government debt, policy interest rate, credit to the private non-financial sector, credit gap, property gap, equity gap, and REER gap, while annual average values are shown for GDP, CPI, the current account balance, and the volatility of local currency. Source: BIS, IMF, World Bank, CEIC and Nomura.