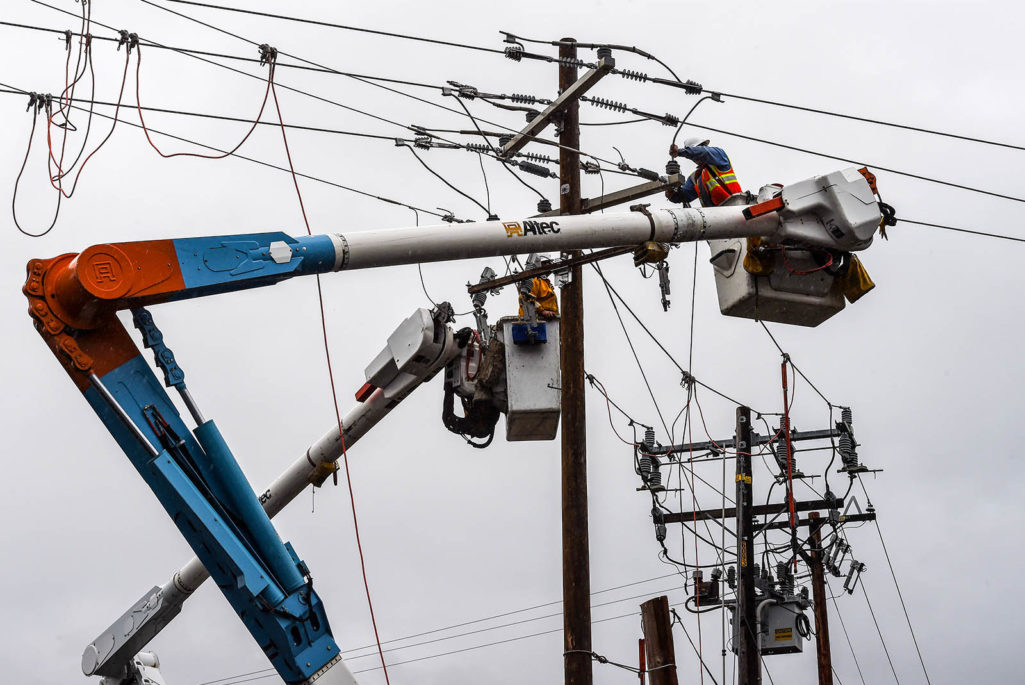
Linesmen from Pacific Gas and Electric repair power lines after the Valley Fire swept through the town of Middletown, California, on September 16, 2015.
Photo: Mark Ralston/AFP/Getty Images
Thanks to digitization, utility customers have more reasons to demand the best reliability possible from their electric utilities—from checking a home camera, to remotely controlling the home thermostat, to charging the vast array of electronics consumers maintain, including their automobiles.
The good news for electric utilities in the United States is that, as a group, they have done remarkably well over the past decade delivering and improving service reliability in terms of the overall frequency of outages, which has been declining. The annual median number of nonstorm service interruptions dropped 11 percent between 2010 and 2015, after falling 16 percent for the five years before (excluding major storms). (See Exhibit 1)
But not every utility has been able to achieve this result. A considerable number of utilities have seen a falloff in reliability (outage frequency), while others are finding further gains increasingly difficult to eke out.
Additionally, reducing the average duration of outages has proven a tougher nut to crack. The Customer Average Interruption Duration Index (CAIDI) increased by nearly 5 percent since 2010. So while lights go out less frequently today than five or 10 years ago, the average interruption to service is somewhat longer. (See Exhibit 1)
Exhibit 1: A Snapshot of U.S. Utility Reliability
Utilities have increased reliability by reducing the frequency of service outages …
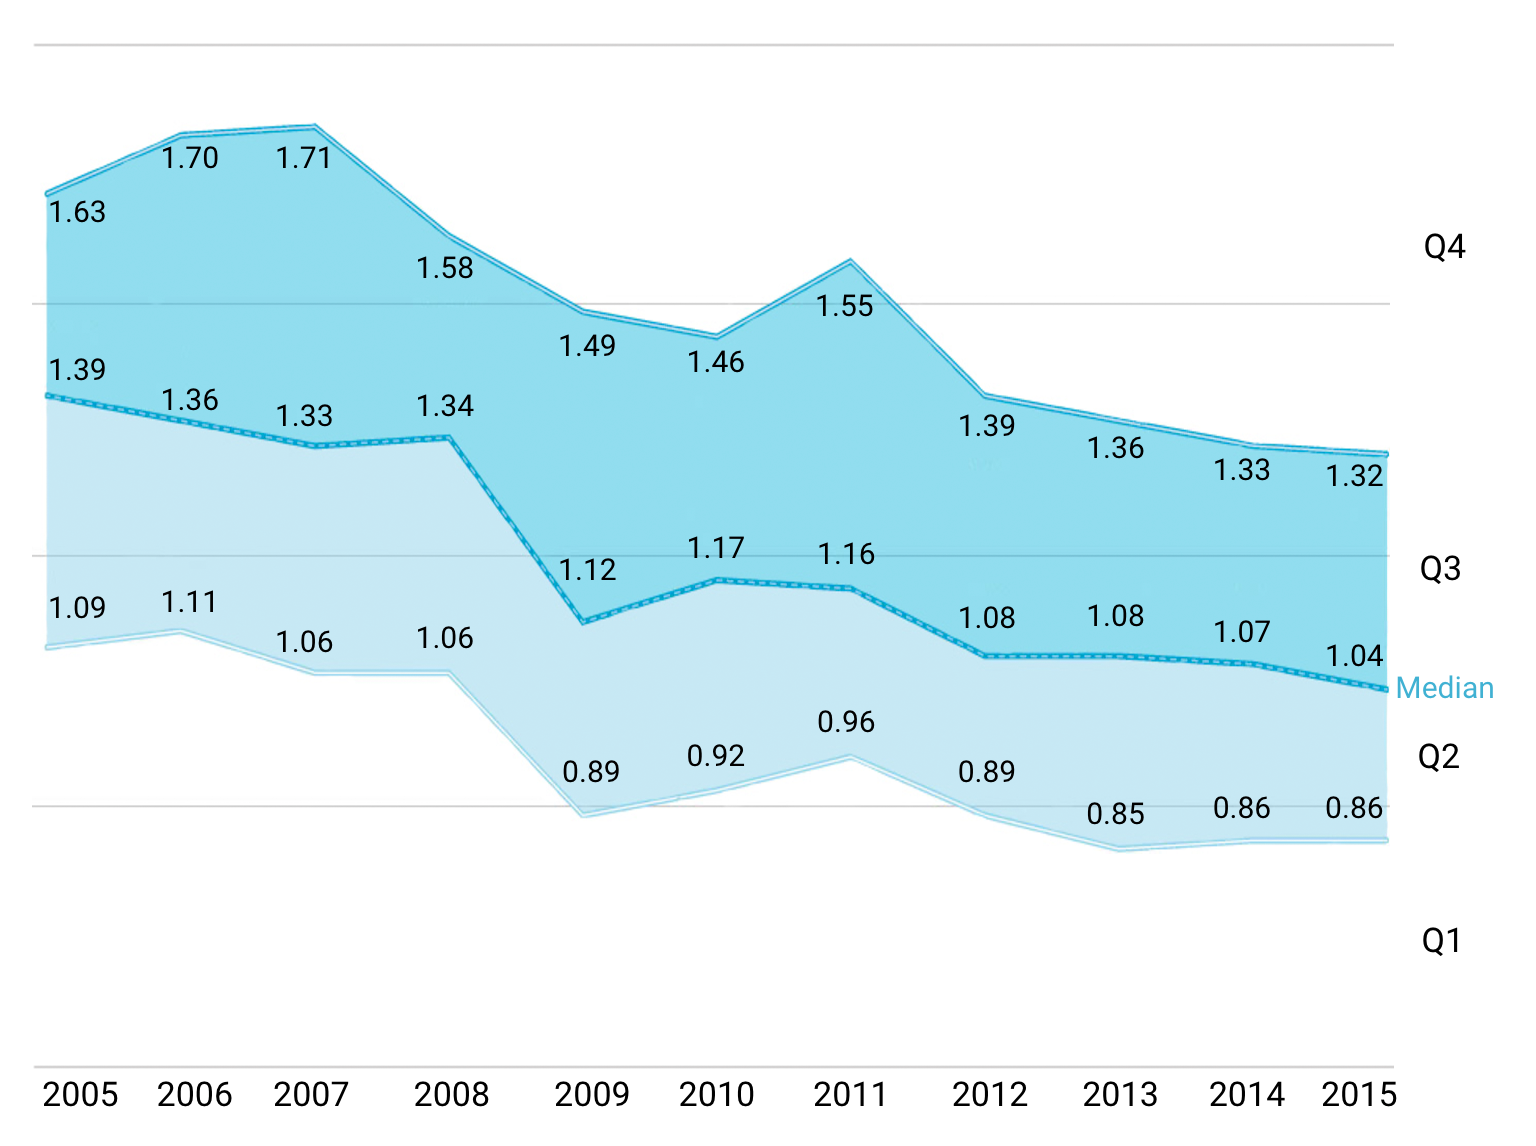
System Average Interruption Frequency Index (SAIFI) by Quartile Annual interruptions per customer, IEEE standard major event days (med) removed. Source: IEEE Distribution Reliability Working Group Benchmark Results 2005 to 2015, Oliver Wyman analysis
But while there are fewer outages, they tend to be longer.
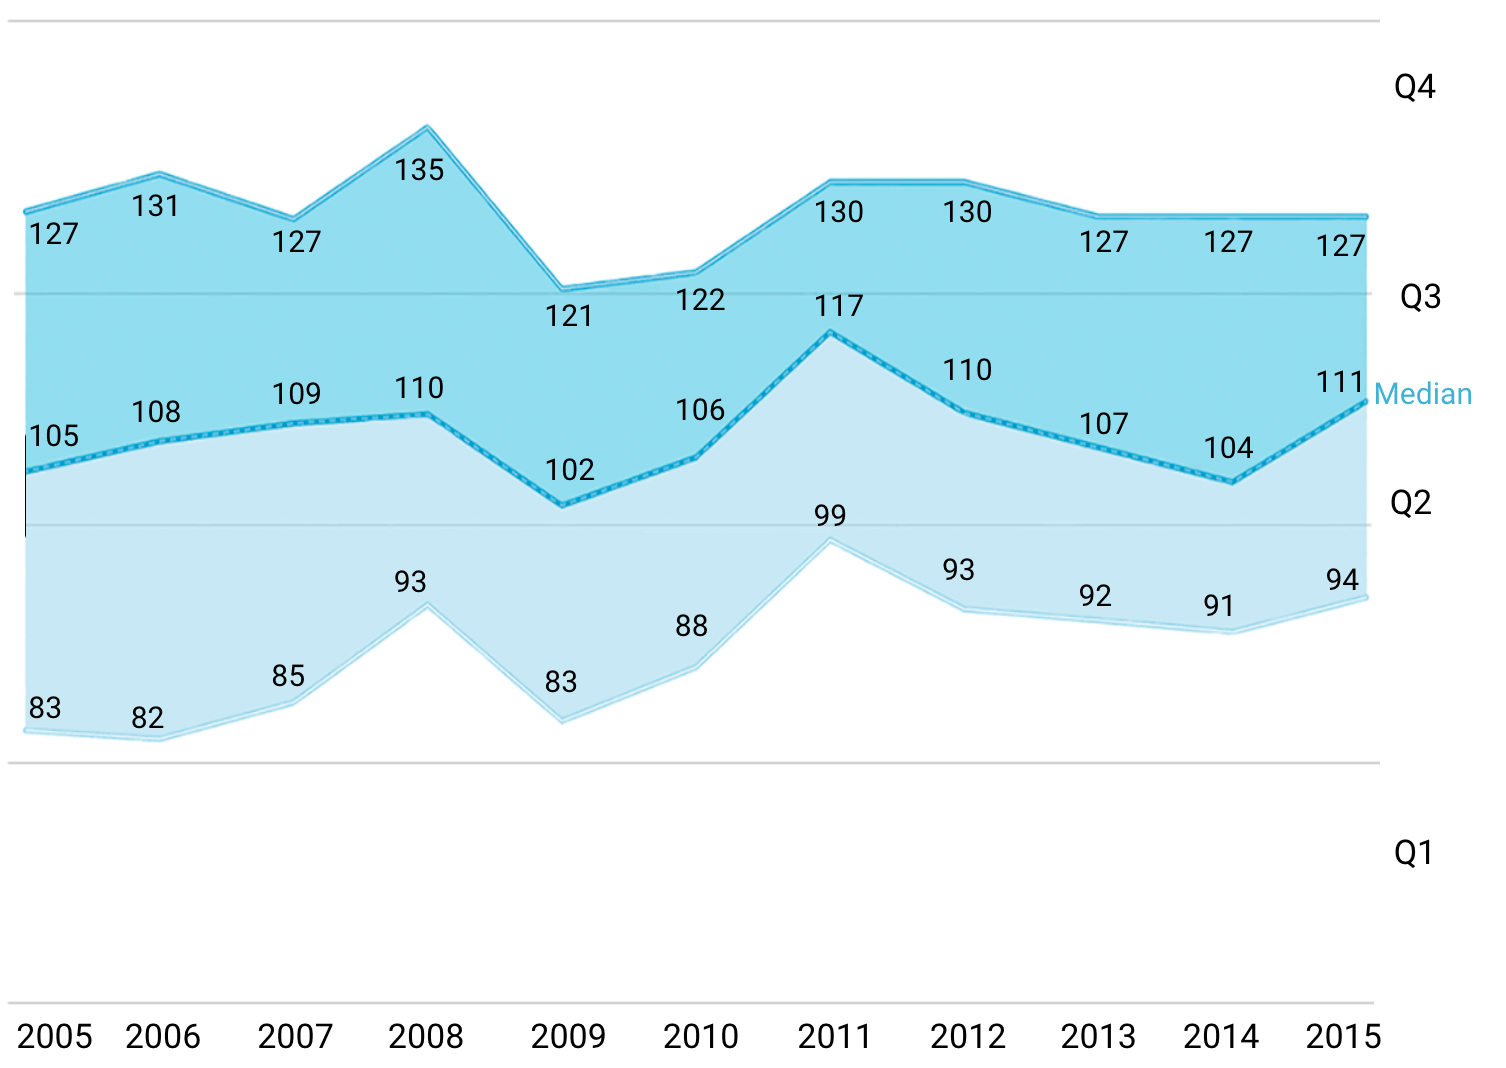
Customer Average Interruption Duration Index by Quartile Average minutes per interruption, IEEE standard major event days (med) removed. Source: IEEE Distribution Reliability Working Group Benchmark Results 2005 to 2015, Oliver Wyman analysis.
That said, some utilities are demonstrating that it is possible to “move the needle” on both fronts of reliability: Nine of the companies benchmarked have improved both their interruption frequency and duration of outage statistics by more than 10 percent over the past decade.
The Need for Analytics
Utilities—even those that have shown improvement—want to do better. Unfortunately, they’re not always looking in the right places and not always supporting decisions with the right analytics.
Small, targeted investments are returning surprising results, according to an Oliver Wyman analysis. Getting maximum reliability improvement from a fixed amount of capital spending or operations and maintenance expense requires utilities to “up their analytic game” to identify and target the specific root causes of the outages, rather than just completely rebuilding a poorly performing circuit.
To identify true cause-and-effect patterns and select the discrete actions to optimize reliability improvement and spending, analytics must separate signals from the noise generated by the volumes of outage and interruption data. The focus of the analysis must be on data directly attributable to relevant assets and preventable outages—rather than simply sweeping all outage data into the probe.
Changing the Network Design
To lower the number of service interruptions, top utilities often start by enhancing the design of their networks. By dividing them up into more sections that can be disconnected from each other, by installing more reclosers, they can reduce the number of customers involved when outages do occur. While this sectionalization approach is relatively straightforward, many utilities fail to maximize the impact of the investment because they don’t use advanced analytics to answer some basic questions such as which outages to consider, where to draw the line on how many reclosers to install, and the optimum number of customers to be included per section.
Every problem (and network) has unique aspects, so a one-size-fits-all approach rarely works. While it requires more effort to do a granular analysis of the various data available, it almost always leads to a more accurate diagnosis of problems and ultimately to the optimization of investments and solutions. Fortunately for utilities, there are a bevy of data sets and technologies available to boost reliability within most budgets.
To tackle the problem of duration, utilities should construct an “anatomy of an outage” to understand what they can do to speed up outage restoration. These anatomies involve tying each increment of time to a step in the utility’s restoration process, from outage notification to full restoration. By constructing such analyses, utilities can identify outlier performance and then drill down to examine individual regions, shifts, outage types, or even the performance of particular dispatchers and crews in the quest to shave minutes from the restoration process. Some leading utilities make use of monthly “anatomy of an outage” reports that are distributed to various field and dispatch work groups.
Beating the Averages
Regardless of their progress with reliability, all utilities have the potential to go beyond the benchmark data for reliability and outage duration and pursue a more customer-centric perspective on reliability performance. Customers do not fully differentiate between momentary and sustained outages. No matter the outage duration—30 seconds, 30 minutes, or 30 hours—customers feel inconvenienced if they must reset an alarm clock or operate in the dark for any period of time. Leading utilities are beginning to examine a permutation of the Customers Experiencing Multiple Interruptions (CEMI) metric, which includes both sustained and momentary interruptions, to identify customers and circuits that have experienced abnormally high levels of outages as a means of further improving customer satisfaction.
Ultimately, customer expectations for highly reliable and uninterrupted electric service will continue to rise, challenging every utility—whether leading or lagging—to improve their performance and the effectiveness of their reliability-related efforts.
This piece first appeared in the Oliver Wyman Energy Journal vol. 3