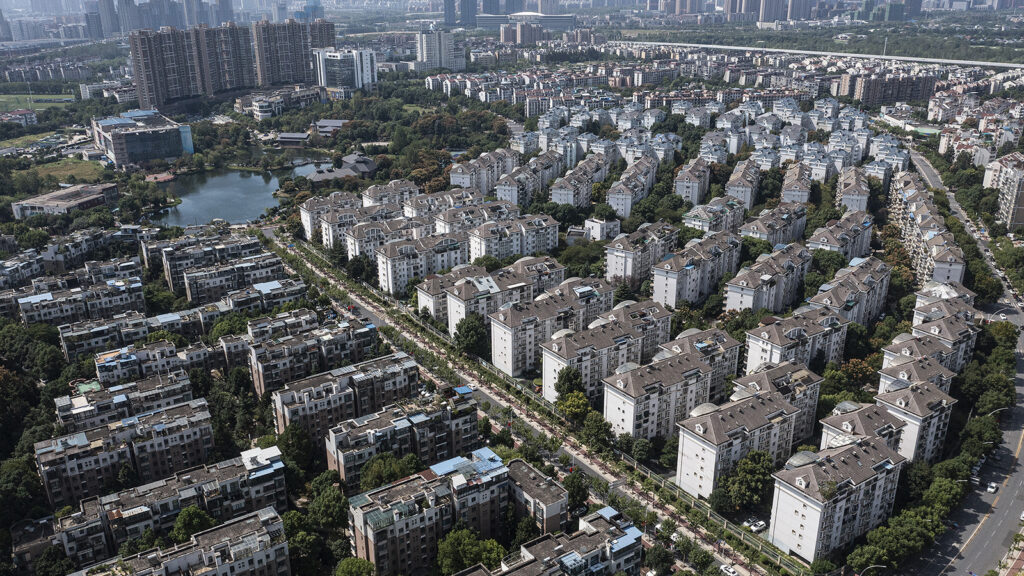
Renewable Energy: China Has Set the Benchmark High
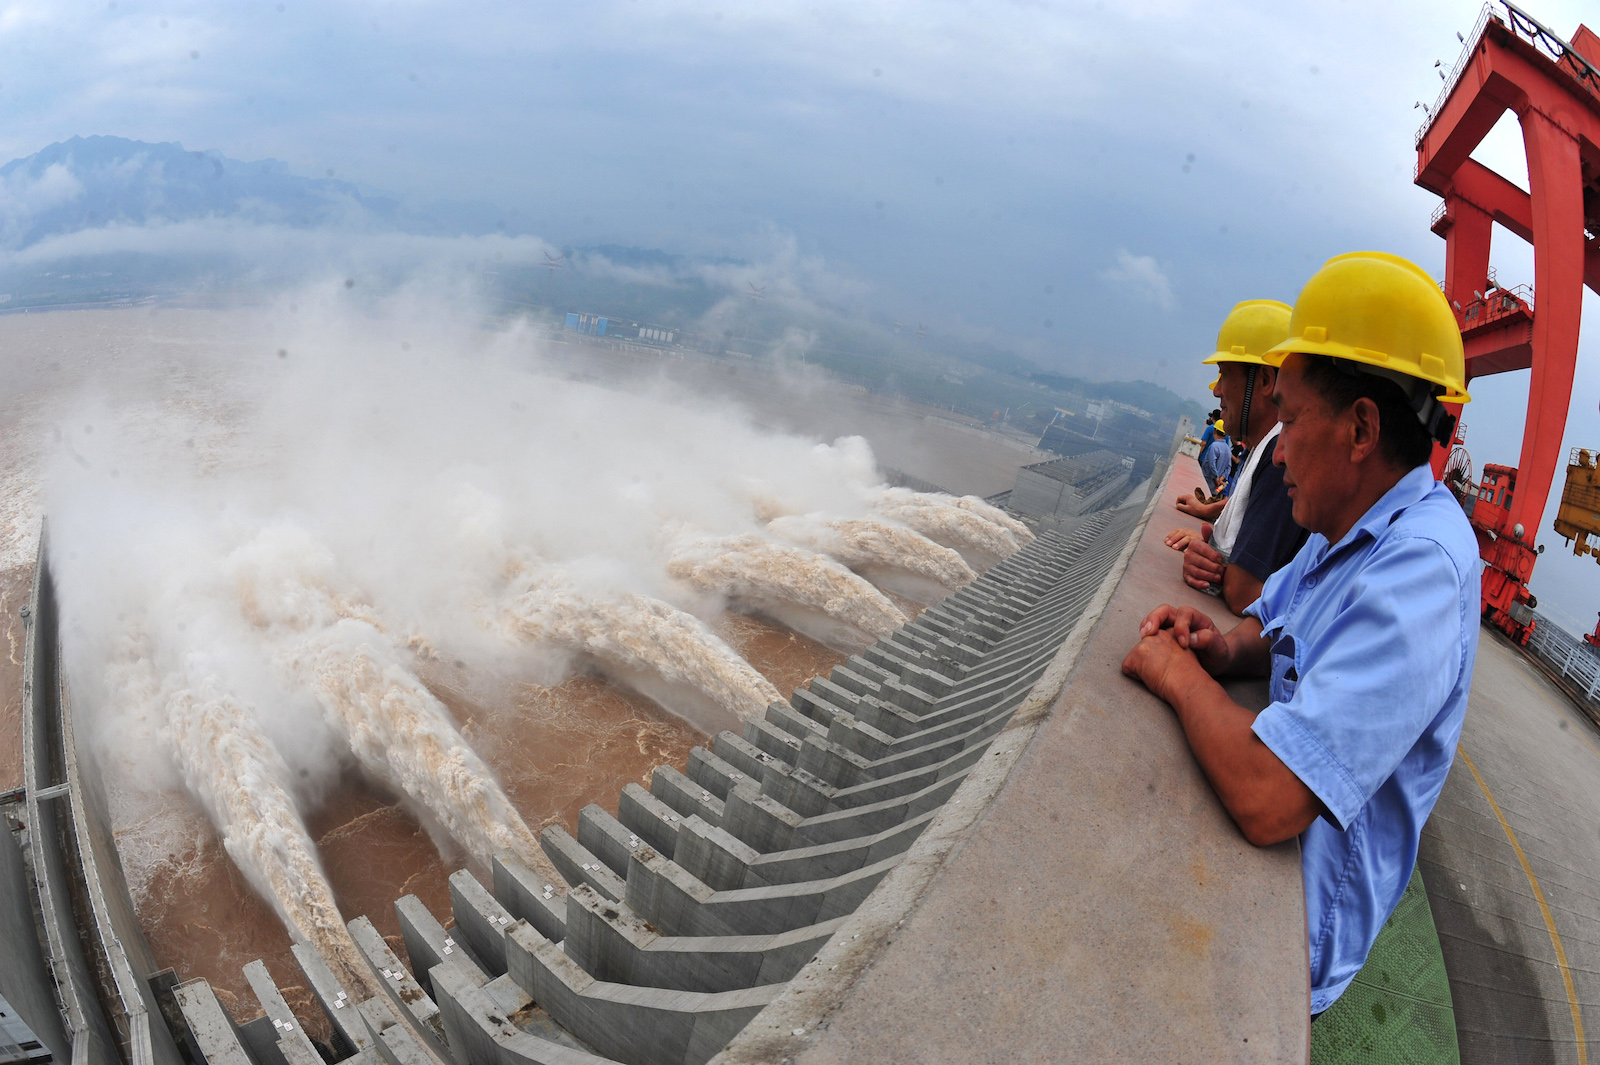
Workers watch as water is released from the Three Gorges Dam, a gigantic hydropower project on the Yangtze river, in Yichang, central China's Hubei province. China alone accounts for a quarter of global renewables production.
Photo: STR/AFP/GettyImages
According to a recent report by the International Renewable Energy Agency, global renewable energy production is making steady inroads globally, with China being the current worldwide leader.
The renewable power capacity data represents the maximum net generating capacity of power plants and other installations that use renewable energy sources to produce electricity. The capacity data are presented in megawatts (MW), while the generation data are presented in gigawatt-hours (GWh).
Global Renewable Energy Highlights
In 2008, the total global renewable energy capacity was 1,060,668 MW. Notable increments were made for each successive year, and by 2017, the figure stood at 2,179,426 MW—a staggering increase of 105.47 percent in just nine years. In addition to Asian economies, African countries made considerable progress, too, with Ethiopia and South Africa making noteworthy gains. At the other end of the spectrum, countries such as Guinea-Bissau, Djibouti and South Sudan are yet to install any renewable energy production capacity.
Exhibit 1: Ten-Year Trends in Renewable Energy (Installed Capacity)

Source: IRENA
In terms of actual production, the global figure in 2008 stood at 3,725,192 GWh. In 2016, global production was 5,885,504 GWh—an increase of almost 58 percent over eight years. Asian countries fared the best in this regard, with a total combined output of 2,222,580 GWh.

China Leads Renewable Energy Production Globally
China alone accounted for three quarters of Asian renewables production and is the global leader as of 2016—producing more renewable energy than all European countries combined. China registered a total production figure of 1,522,586 GWh. Its closest contender was the U.S., with a total production of 637,076 GWh followed by Brazil at 465,579 GWh.

China has clearly prioritized renewable energy production, as is evident from its year-on-year production gains. Between 2008 and 2016, it has more than doubled its production. In contrast, Japan, while a highly developed economy, only managed one-tenth of China’s renewable energy output, underscoring China’s impressive performance. Hydropower contributed the bulk of China’s total output, accounting for 1,193,370 GWh in 2016. China has also effectively harnessed wind energy, which was the second leading source of its renewable energy, accounting for 242,388 GWh. This is a noteworthy figure, considering that total wind energy production by Asian countries was 294,506 GWh. Europe fared best in wind energy production, with Germany and Spain ranking first and second, respectively.
China also led in terms of solar energy production, as well as in deriving energy from renewable municipal waste. It ranked second (Germany ranked first) globally in the production of bioenergy. The renewable energy source that contributed the least to China’s total output was marine energy—recording just 7 GWh in 2016.
India Has Immense Untapped Potential
In 2008, India recorded total renewable energy production of 141,340 GWh on the back of an installed capacity of 47,239 MW. Unlike most countries that have registered consistent annual increments, India hit its peak output of 202,218 GWh in 2014. Subsequently, its renewable energy output declined to 189,226 GWh two years later. However, it still fares better than Japan (158,822 GWh) and South Korea (12,815 GWh). As with China, hydropower accounted for the largest share of renewable energy produced. The figure in 2016 stood at 130,221 GWh. India has no installation for harnessing marine energy, and only recently has bagasse-derived energy been explored. Bagasse is the fibrous matter that remains after sugarcane stalks are crushed. Interestingly, although the northern plains of India had traditionally been a major belt for sugarcane cultivation, bagasse-derived energy production is still only in its infancy.
Of the total 294,506 GWh of Asian wind energy production in 2016, India was the second largest contributor with 36,273 GWh. Although it ranked second to China, the disparity between both countries was vast. Solar energy production, too, was low in India at a mere 9,790 GWh in 2016. However, it was a significant leap from a dismal 32 GWh in 2008.
How Well Are CLMV States Performing?
Cambodia’s annual renewable energy production in 2016 was 2,641 GWh, of which 2,568 GWh came from hydropower. This signified strong dependence on fossil fuel-derived energy. Laos recorded a total output of 17,952 GWh, while Myanmar registered 9,436 GWh. Vietnam posted strong results with a total annual output of 63,654 GWh. Similar to other Asian countries, hydropower contributed to over 90 percent of all CLMV (Cambodia, Laos, Myanmar and Vietnam) countries’ renewable energy. While the proliferation of solar power has been rapid, its share of renewable energy contribution was extremely low—with Laos having recorded only 2 GWh production in 2016.
Positive Trends
Although the progress made by different Asian economies has been uneven, it is nonetheless evident that significant progress has been made by all countries since 2008 in terms of renewable energy production. An increasing population will result in continually higher demand for energy, and renewable sources allow economies to meet this surge in demand—and importantly, contribute to transitioning to a lower-carbon economy in accordance with the Paris Agreement.
Although hydropower is currently the leading form of renewable energy in Asia, wind, solar and bioenergy are viable options, too, and are fast picking speed across the region. Further capacity increases can only be added by exploring varied avenues for generating renewable energy and sparking a transition from fossil fuel use, an imperative for Asia.