50 Years of Asian Economic and Emissions Growth

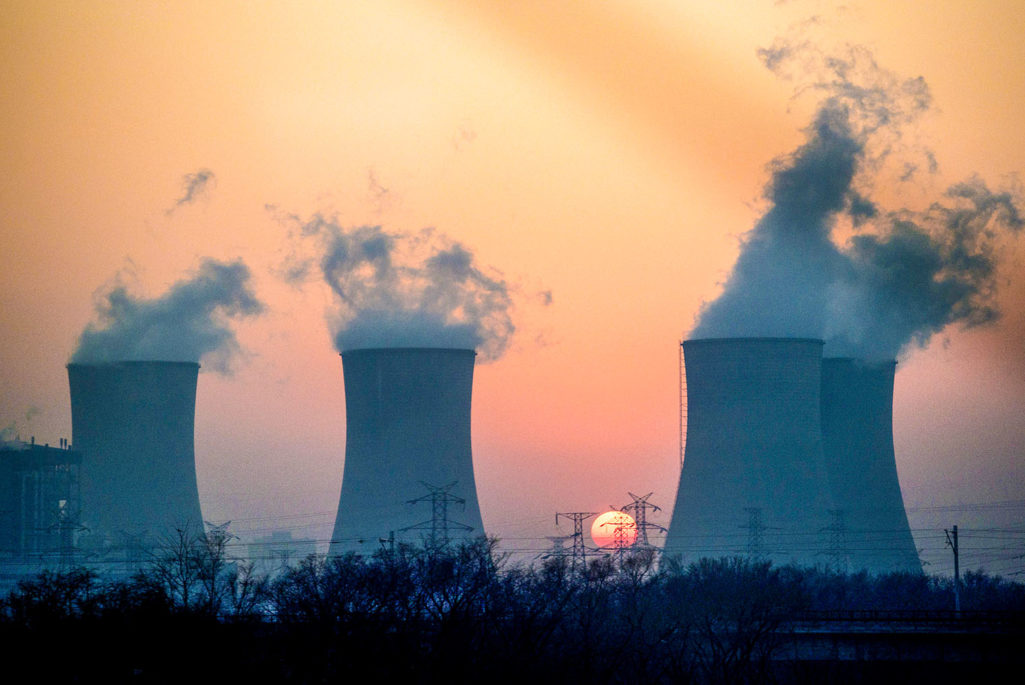
Smoke rises from a power plant near Hengshui in China's Hebei province.
Photo: Fred Dufour/AFP/Getty Images
The Asia Pacific region has seen its share of global gross domestic product (GDP) increase from just 12.7 percent in 1960 to 31 percent at the end of 2015, according to the Asian Development Bank (ADB), but this growth has paralleled an increase in both population and greenhouse gas emissions in the region.
Robust Economic Growth
Over the last five and a half decades, Asia has seen “enviable economic growth” that has been both “consistent and robust”, ADB said. This growth has been driven by the likes of China, India, Japan and South Korea at different points in time. While Japan became an economic powerhouse and led the region’s economies after World War II, the mantle shifted to South Korea, which led the regional economies to success through policies including a boost in production and exports.

Asia and the Pacific’s Share of Global Gross Domestic Product, 1960–2015
Source: ADB estimates using data from World Bank. World Development Indicators.
http://data.worldbank.org/data-catalog/world-development-indicators (accessed 5 October 2016).
Since the late 1970s, the growth has been led by China, where economic growth took off in the late 1970s (through opening up its economy) and the early 1980s (through the launch of domestic reforms); and India, which began pursuing economic reforms and liberalization in 1991.
As incomes have grown across the region, life expectancy has increased from 46 years in 1960 to 71 years in 2015. This has been coupled with an increasing population in the region, which has grown from 1.6 billion to 4 billion (out of a global population of 7.3 billion) in the same period.
Rapidly Growing Carbon Emissions
One of the big challenges confronting the region today, as a result of its strong economic performance and its growing population, is Asia’s rising share of energy consumption and its growing carbon dioxide emissions. According to the ADB, the region now accounts for about 45 percent of global energy consumption.
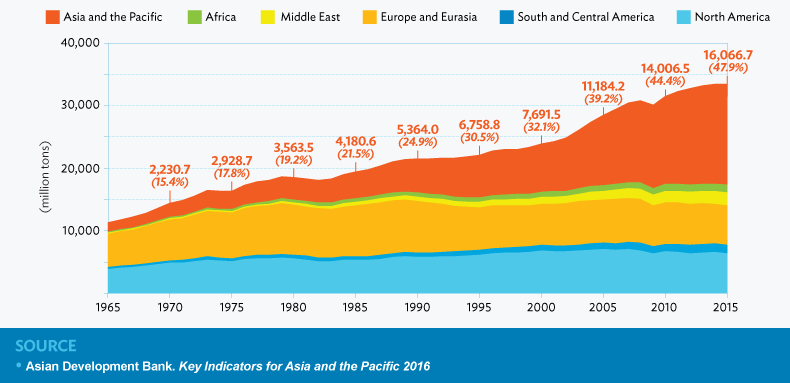
While the region’s emissions increased at a decreasing rate from the 1960s through the 1990s, they have accelerated over the past decade and a half. Asia’s carbon dioxide emissions have increased from 2230.7 million tons (15.4 percent of the global share) in 1970 to 16066.7 million tons (47.9 percent of the global share) in 2015.
The biggest percentage increases in per capita emissions of greenhouse gases between 2000 and 2012 were seen in Cambodia (142.4 percent), China (118.7 percent) and Vietnam (87.5 percent), while the large reductions were seen in Singapore (-64.7 percent), Australia (-13.8 percent) and New Zealand (-11.6 percent).
One way for the region to check its emissions is for renewable energy to comprise a greater share of the energy consumed, but that is not happening yet. While renewable sources provide more than 80 percent of final energy consumption in Bhutan, Laos and Nepal, and more than 50 percent of energy consumption in economies such as Myanmar, Cambodia and Sri Lanka, the share of renewable sources in final energy consumption in most Asian countries has decreased since the year 2000.
This demonstrates that one of the key challenges for Asian policymakers in the years ahead is striking the balance between the pursuit of economic growth and limiting the impact of such growth on the environment.


