Enhancing Productivity Through Workforce Analytics

White-collar workers walk on a crosswalk in Tokyo on April 3, 2017. The Bank of Japan's Tankan report—a quarterly survey of more than 10,000 companies—showed a reading of 12 among major manufacturers, rising from 10 in the previous survey.
Photo: Toshifumi Kitamura/AFP/Getty Images
We recently outlined the challenges from slowing productivity growth in Asia and how they threaten to exacerbate the impacts of a macroeconomic slowdown at this time.
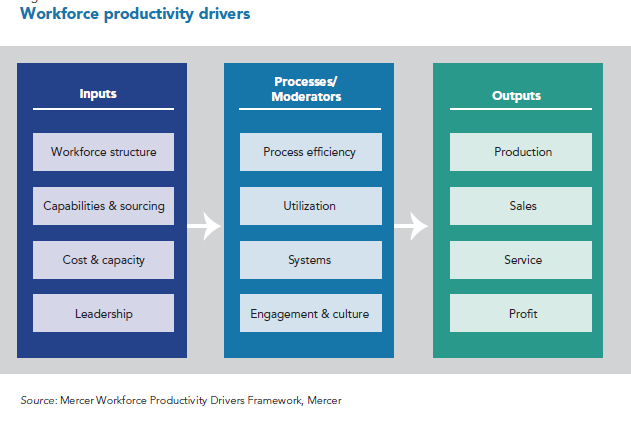
Let us examine how organizations may leverage workforce analytics to solve the productivity challenge. While working with clients on improving workforce productivity, we often think about the causal chain that suggests that “effects are an outcome of a unique blend of cause and conditions.” The goal of such an analysis is to uncover these causes and conditions. Once these causes and conditions are known, it allows organizations to proliferate them in a systematic manner to lift productivity.
For example, in trying to improve sales productivity we often think about capability sets (cause) that lend to high productivity. But we need to also think of the organizational conditions (conditions) that allow for that capability to flourish.
There is a well-known adage in the analytics world: Not everything that can be measured matters, and not everything that matters can be measured. That said, it is important to know what the key metrics for each unique business are, as well as specific metrics in a particular process or business segment. Besides identifying the right metrics and corresponding causes and conditions, gaining alignment with key stakeholders as to what is important and what levels of performance are necessary in both current and future scenarios is key.
To determine performance targets, employers often obsess about benchmark data. Sometimes the challenge of getting this data becomes a barrier for embarking on workforce productivity initiatives. However, employers often have sufficient information at their disposal if they dig into their own data sets. While having benchmark data provides a good external perspective, the validity and contextualization of that data for the employers’ unique business often raises skepticism. Employers should establish benchmarks based on their own performance variability. If the top-quartile business units or incumbents are doing significantly better than average business units/employees within their own business, organizations would do well to uncover the cause and conditions that lead to that variance. Therefore, an organization should start by mining its own data and checking for variances on defined metrics to define performance goals in a workforce analytics initiative.
Based on the analyses conducted and insights uncovered, in the Employing Analytics to Enhance Workplace Productivity report, we are able to progress to the “use” phase. This is when the insights are used to test real-life situations to determine whether they affect the outcomes being sought. Having the ability to think through how the insights will be tested—before seeking the investments to proliferate programs across the larger organization—is crucial in driving return on investment (ROI) from workforce analytics initiatives. At this stage, the business sponsors, while being charmed by the analytics, would be looking for evidence that the implementation of the changes suggested will indeed lift performance.
Several experimental design formats are available to prove one’s case (for example, intervention group versus control group). It is important to engage with stakeholders to roll this out in a way that does not lead to dilution of the efficacy measurement. While this may be the last step in the process, it needs to be planned upfront since it will inform the workforce analytics design activity.
A Case in Point
In our work with a large retail bank in Southeast Asia, we were able to deploy workforce analytics to both identify underlying productivity issues as well as develop strategies to address those issues. The bank was faced with over 80 percent attrition of its frontline sales staff. That, coupled with continuing pressures on margins, meant that the sales leader was unable to replace every employee lost and insisted on hiring only sales professionals who met a certain minimum threshold of expected performance.
We investigated what appeared to be a need for more robust assessment tools at the time of hiring. The first revelation was an 80x gap in sales performance of their top-quartile sales professionals compared with the bottom quartile. This highlighted that it was more critical to stop hiring professionals who exhibited traits similar to those in the bottom quartile, instead of focusing on hiring individuals with the right skills. Just curbing the hire of “poor performers” through advance signals lifted sales productivity of the organization.
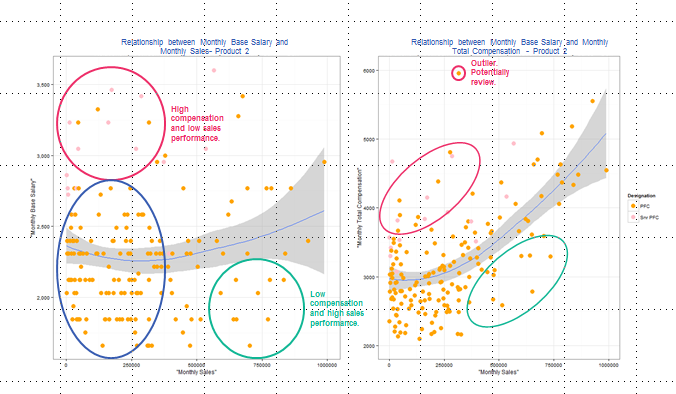
We also investigated opportunities to optimize the compensation expenses for the sales organization by checking for the relationship between base (and incentives) pay with sales performance. It emerged that the deserving high-performers were not the best paid, while a number of employees achieving mediocre sales were being compensated more.

Employees below the blue line are underpaid relative to their peers while those above the line are overpaid. Source: Mercer Workforce Analytics
The third fact uncovered by using workforce analytics was that on average, new hires took five months to reach peak sales performance. This metric is referred to as “time to productivity,” a more critical indicator than say “time to hire.” This raised further investigation to uncover the conditions that lead to peak performance, which enabled the organization to accelerate the “time to productivity” timeline.
Lastly, the effects of sales capability on performance were evaluated by tracing back monthly performance of the top-quartile, middle and bottom-quartile performers through the course of the year. Unsurprisingly, it was found that the top-quartile performers had a lead over the mid and bottom quartile performers through every month in the year, providing evidence that sales talent is an important ingredient in sales performance. Surprisingly, while the mid and top sales performers improved over time, the bottom performers’ performance through the year remained flat. This led to talent management solutions to optimize the talent mix in sales teams.
The application of workforce analytics tools enabled the development of actionable insights to enable the organization to optimize the sales staffing model, the team structure, skills inventory of the right sales persona and the compensation structure.
Getting Started
Organizations in Asia often tend to avoid undertaking analytics as a means to dive deeper into the productivity challenge. This is usually because they are unsure of the quality or robustness of their own workforce data and metrics.
Herein lies a misconception.
Workforce analytics can be leveraged in any organization regardless of the availability of structured workforce data. Simple sources such as payroll can reveal much about underlying drivers of productivity. What is needed is an analytics mindset among executives as they approach the productivity challenge. The best time to start is always now.
The first piece on this topic looked into the challenges from slowing productivity growth in Asia. The full report published by the Workforce Analytics Institute can be found here.


