Health and Safety in the Age of the Megacity

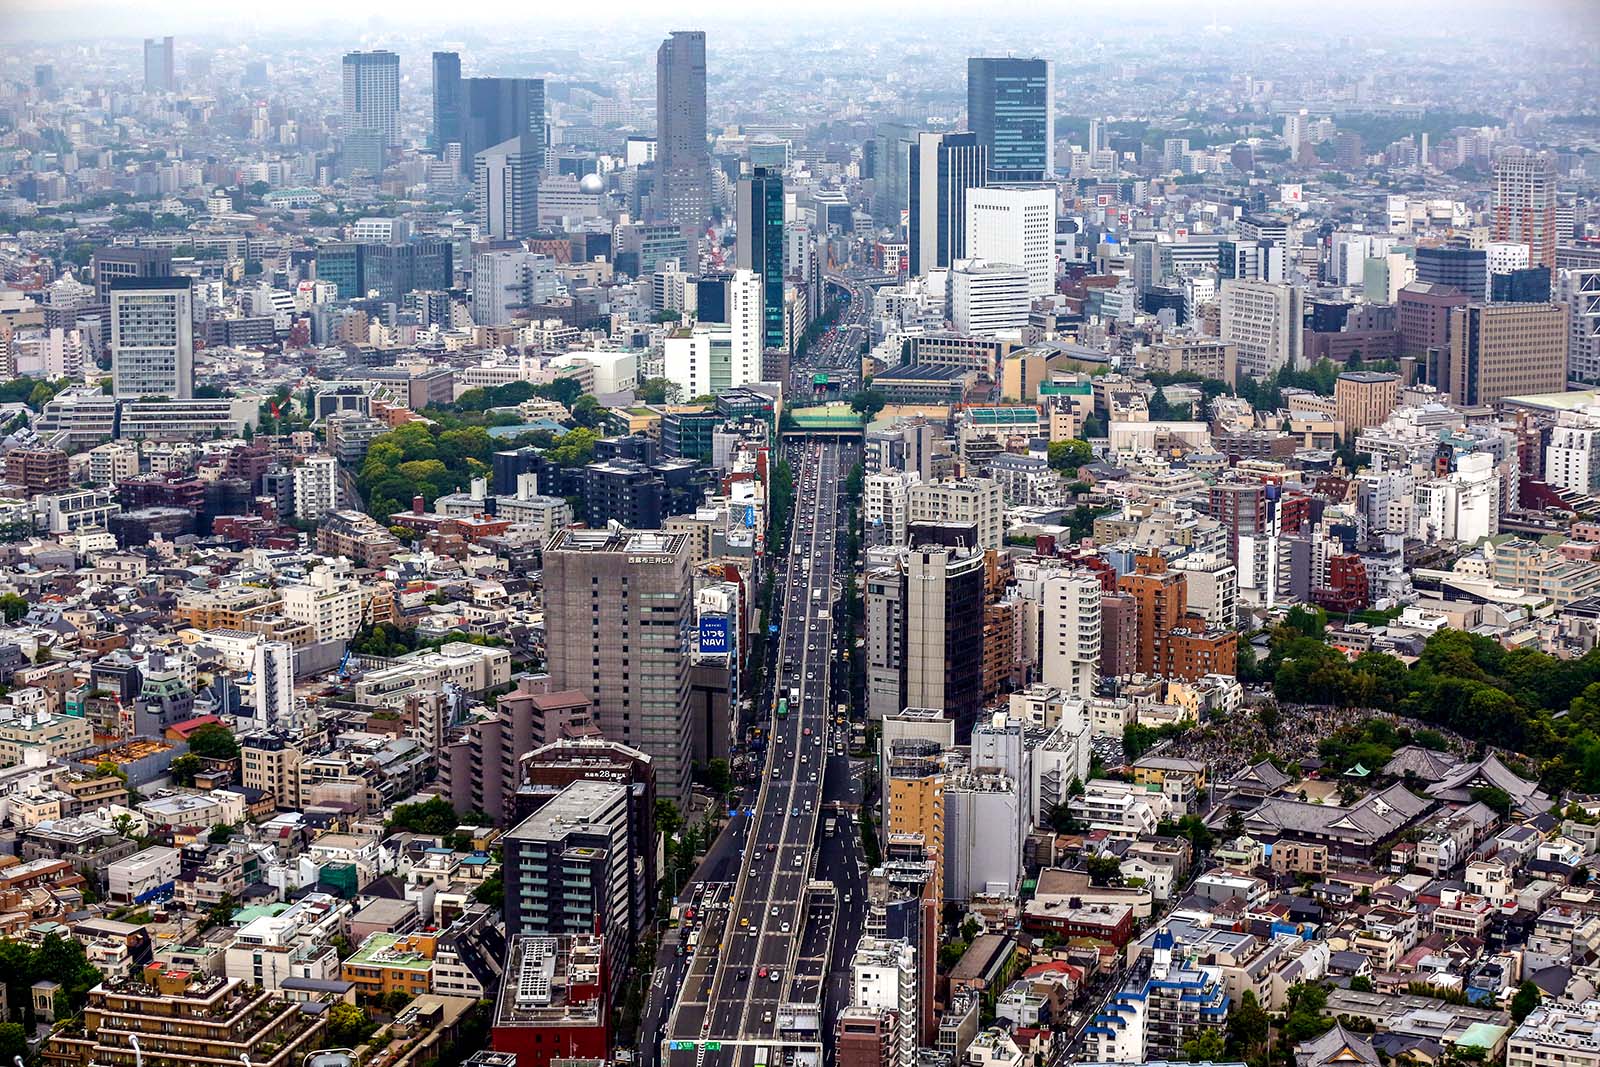
The Greater Tokyo Area is the most populous metropolitan area in the world, with a population of 13.5 million. As the share of city dwellers increases in almost every region of the world, questions about health and safety are coming to the fore.
Photo: Carl Court/Getty Images
This is the second piece in a weeklong BRINK series on the Future of Cities. The rest of the series can be read here.
The rise of cities around the globe has ushered in great challenges and great opportunities for citizens and businesses. As the share of city dwellers increases in almost every region of the world, questions about health and safety in these dense environments becomes paramount.
By 2050, 68 percent of the world’s population will be urban. The data points outlined below pull into focus a picture of the trends that are expected to unfold over the coming decades—from the implications of population growth for healthcare access to the exposure to risk that people and businesses face while living in urban environments.
Exhibit 1: Urbanization Trends, 1950-2050
The share of people living in cities is projected to rise in every region of the world. One in five of the world’s urban dwellers live in a city with more than 1 million people. One in eight live in a megacity, defined as a city with more than 10 million inhabitants.
There are currently 33 megacities in the world; that number will rise to 43 by by 2030, the UN predicts. By 2050, the world’s urban population is projected to grow by 2.5 billion; almost 90 percent of this growth will be in Asia and Africa.
Exhibit 2: City Growth Rates by Size Class, 2018-2030
Urbanization is a product of migration as well as natural population growth within cities. It brings its own set of opportunities and challenges for the future of global welfare.
The Challenge Ahead: Health Equity
“Urban areas enjoy many advantages compared to rural areas when it comes to availability of resources that support good health,” notes the World Health Organization. With better basic infrastructure, health care service availability, and communication and educational opportunities, “urbanization is associated with economic and social development that provide better opportunities to achieve good health.”
Yet enormous inconsistencies in health conditions exist both between and within cities. These divergences are not limited to developing cities with vast slums. One study found that the average life expectancy of a Londoner varies as much as 20 years depending on where the person lives. In fact, “every two stops on the London Underground traveling east from central London represented more than one year of life expectancy lost,” the WHO reported.
The disparities can be measured using WHO’s “Urban Health Index,” which combines a variety of population health indicators in a single number to facilitate comparisons between different areas. Here’s a map showing index disparities within the city of Atlanta, with dark-red areas indicating areas that are severely disadvantaged and the lighter orange and yellow areas indicating less disadvantage.
Exhibit 3: Health Disparities in Atlanta Using the Urban Health Index
In a 2016 report, WHO computed the Urban Health Index for 57 cities in 53 low- and middle-income countries. Index indicators covered basic infrastructure, individuals’ health knowledge and health service coverage.
Exhibit 4: Urban Health Index for 57 cities (Higher Number Indicates Better Conditions)
The report found wide variations in health conditions between cities, even if they were located in the same region and had similar levels of national wealth. Very large cities may be especially hard to manage: On average, megacities (over 10 million population) had the worst conditions. Conditions were generally better in cities of less than 1 million.
Risk of Disaster
Urbanization can increase vulnerability to disaster, especially when it is poorly planned. As the firm Control Risks has stated, “The concentration of human, physical, and financial capital in cities renders them especially vulnerable to both immediate devastation and lingering disruption to transport, commerce, and communications in the aftermath of major disasters.”
According to the UN, 56 percent of cities with at least 300,000 inhabitants in 2014, the most recent year for which data were collected, were at high risk of exposure to at least one of six types of natural disaster: cyclones, floods, droughts, earthquakes, landslides and volcanic eruptions.
Exhibit 5: Cities’ Risk of Exposure to Natural Disasters
Fifteen percent of cities were vulnerable to two or more types of disasters. Twenty-seven cities—including the megacities of Tokyo, Osaka and Manila—faced risks from three or more types.
More than 80 percent of cities were located in areas with high risk of mortality or economic losses associated with at least one type of natural disaster. The risk was highest in larger cities and less-developed regions.
Floods were the most common natural disaster, followed by droughts and cyclones. These disasters also were the most devastating in terms of mortality and economic losses, the UN reported.


