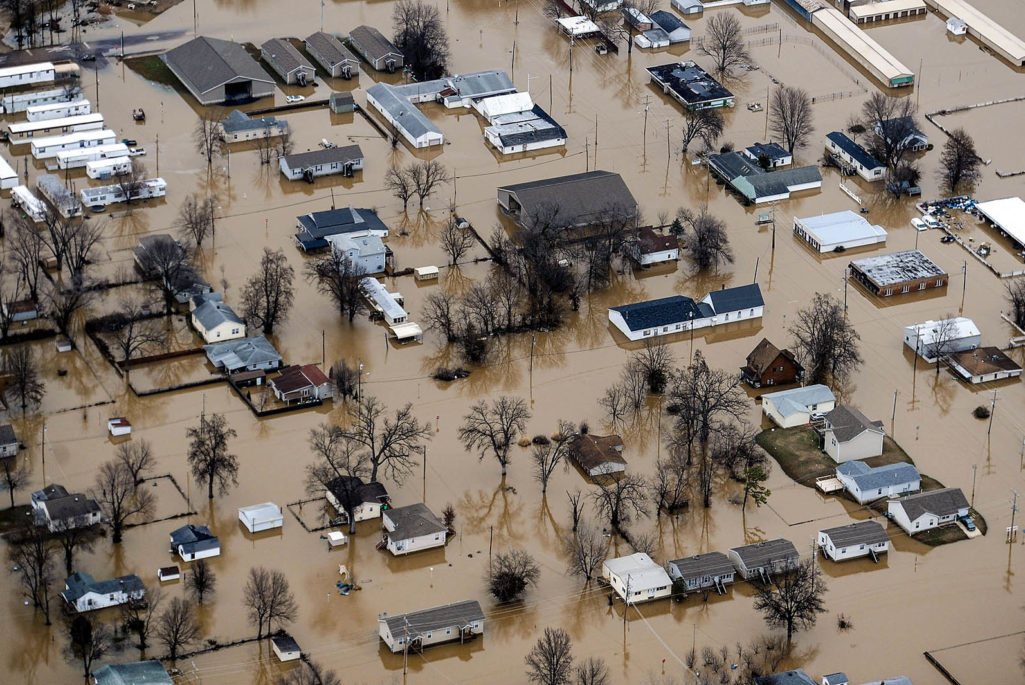
Neighborhoods are seen submerged in flood water from the Meremac River on December 31, 2015 in Pacific, Missouri. The St. Louis area and surrounding region saw record flood crests of the Mississippi, Missouri and Meremac Rivers after days of record rainfall.
Photo: Michael B. Thomas/Getty Images
Floods are the most damaging natural disaster in the United States, as well as globally, with losses rising dramatically over time.
In the U.S., hazard maps from the Federal Emergency Management Agency (FEMA) delineate the 100-year floodplain. Federal outreach warns residents that floods are possible. But residents are often left wondering if they should worry about flooding if the chance of one occurring is low. Residents often have no idea of what level of damage they can expect should a flood occur. Will it be minor, something they can easily handle, or will it cause severe damage to their home?
In the U.S., residential flood insurance is primarily available through the federal National Flood Insurance Program (NFIP). (Homeowners can insure up to $250,000 for building coverage and up to $100,000 for contents.) Today there are 5.1 million policies in force nationwide, accounting for $1.2 trillion in coverage and $3.5 billion in annual premiums, giving an average flood insurance premium of less than $60 per month.
In a paper recently published in the Journal of Risk and Insurance, we examine 35 years of residential flood insurance claims in the U.S., the first empirical study of such magnitude with more than 100 million policy-year data points. After reviewing flood claims for the U.S. between 1978 and 2012, what should a resident of a flood-prone area know? We offer four insights about potential flood damages.
- Damages are often modest (less than 10 percent of the building value), but they can be catastrophic.
More than a quarter of claims are less than $5,000. Close to half of all single-family flood claims over all the years are less than $13,000 and around 75 percent are less than $40,000 (2012 price corrected for inflation). But the 99th percentile is approaching $300,000. Of course, the size of a claim is determined somewhat by the value of the house. Half of all claims are for less than 10 percent of the building’s estimated value, but the 99th percentile is total loss of the home.
The distribution of flood claims is decidedly fat-tailed; there are outlier claims and years that can be quite high. For the program as whole, the worst year to date was 2005, in the aftermath of Hurricane Katrina. The claims paid out by the NFIP for Katrina were greater than the sum of all payments made by the program before 2005. Not only was 2005 a bad year for the program due to the large number of simultaneous claims, but these claims were also much larger in magnitude. For example, over all years, less than 1 percent of claims are at the NFIP coverage cap, but roughly 78 percent of those occurred in 2005.
Consumers are often reluctant to insure against disaster risks. Perhaps they are overly optimistic or assume, correctly, that the majority of the time, damages will not be extreme. The challenge with this is that when a disaster does occur, homeowners are without financial protection. The vast majority of residents in areas inundated by Superstorm Sandy were not insured against flooding. Some individuals may prefer a policy designed just for insuring catastrophic damage—that is, a policy with a very high deductible and a high coverage cap. This is possible under the NFIP and would be much less expensive than choosing a low deductible. On the other hand, some consumers feel that if they are going to pay for insurance, they want it to pay out no matter the level of damage. For high-risk individuals, this will be much more expensive.
Too much communication about the 100-year floodplain gives a false sense of security to those in other flood areas.
- Claims are increasing through time but spread broadly through space.
Flood claims have been increasing over the decades, in inflation-adjusted terms. This is true even if we exclude the impact from Katrina. Many other studies have found that disaster losses are increasing from multiple factors, not least of which is where and how we build. This holds for flood claims, as well.
There is substantial heterogeneity in flood claims around the country. Total paid claims over all the years are predictably greatest where there are lots of policies in force and where there have been big correlated loss events (hurricanes, for this program). The greatest share of paid claims through the NFIP up until 2012 were from Louisiana, followed by Texas and then Florida. If we look at median household claims, however, those are spread much more widely geographically. Severe property-level damage can occur from all types of flood events, not just storm surge.
- The claim rate is not statistically different inside and outside the 100-year floodplain.
In the U.S., much communication about flood risk centers on the 100-year floodplain line. This creates a false sense of safety for residents outside the 100-year line and does not indicate that risk can vary dramatically within the 100-year floodplain as well. While claims are, of course, driven by who purchases insurance, we find that roughly 30 percent are outside the 100-year floodplain.
Interestingly, we find the claim rate is not statistically different inside and outside the 100-year floodplain. This is likely explained by two factors. First is that outside the 100-year floodplain, flood insurance purchase is voluntary and only the riskiest property owners choose to insure, so there is an adverse selection problem. Second, in many locations, FEMA maps may be out-of-date or have some inaccuracies.
In our analysis, we were able to quantify the magnitude of claims—on average, all else equal—across the FEMA-mapped flood zones. Claims in 100-year floodplains that are not subject to storm surge are higher than outside the 500-year floodplain by 20 to 25 percent. Claims in the 500-year floodplain are higher than outside it by 13 to 17 percent. And claims in coastal areas subject to storm surge are higher than outside the 500-year floodplain by about 35 percent. This much higher amount for surge claims is likely explained by the force of the water.
- The adoption of risk-reduction measures will reduce your flood loss.
Properties categorized as “pre-FIRM” (Flood Insurance Rate Map) are structures built before FEMA mapped the flood hazard in a community and are, therefore, not built according to the NFIP building code requirements. These are inherently riskier properties and we can see this in the claims data. Between 1978 and 2012, more than 75 percent of claims are from pre-FIRM properties. In terms of magnitude, pre-FIRM claims as a percent of a building’s value are 42 to 45 percent higher than post-FIRM claims.
Historically, these riskier properties with larger claims also were eligible for premium discounts. Recent reform legislation in 2012 and 2014 is slowly phasing out these price discounts. When a property is substantially damaged or expanded, it must come into compliance with current maps and is no longer pre-FIRM. We find that while the percent of policies that are pre-FIRM has been declining, the percent of claims that are pre-FIRM has been falling at a much slower rate. These properties continue to be a burden to the program.
For properties that have been raised above the base flood level, claims as a percent of building value are more than 15 percent less than non-elevated homes when a flood occurs. We also find that communities that participate in the voluntary community rating system program to engage in more communication about flood risk and reduction measures have lower claims on average. The community investments do indeed help residents sustain less damage when a flood occurs.
The authors also reported these findings in Resources magazine.