The Virtuous Cycle of Infrastructure Bonds
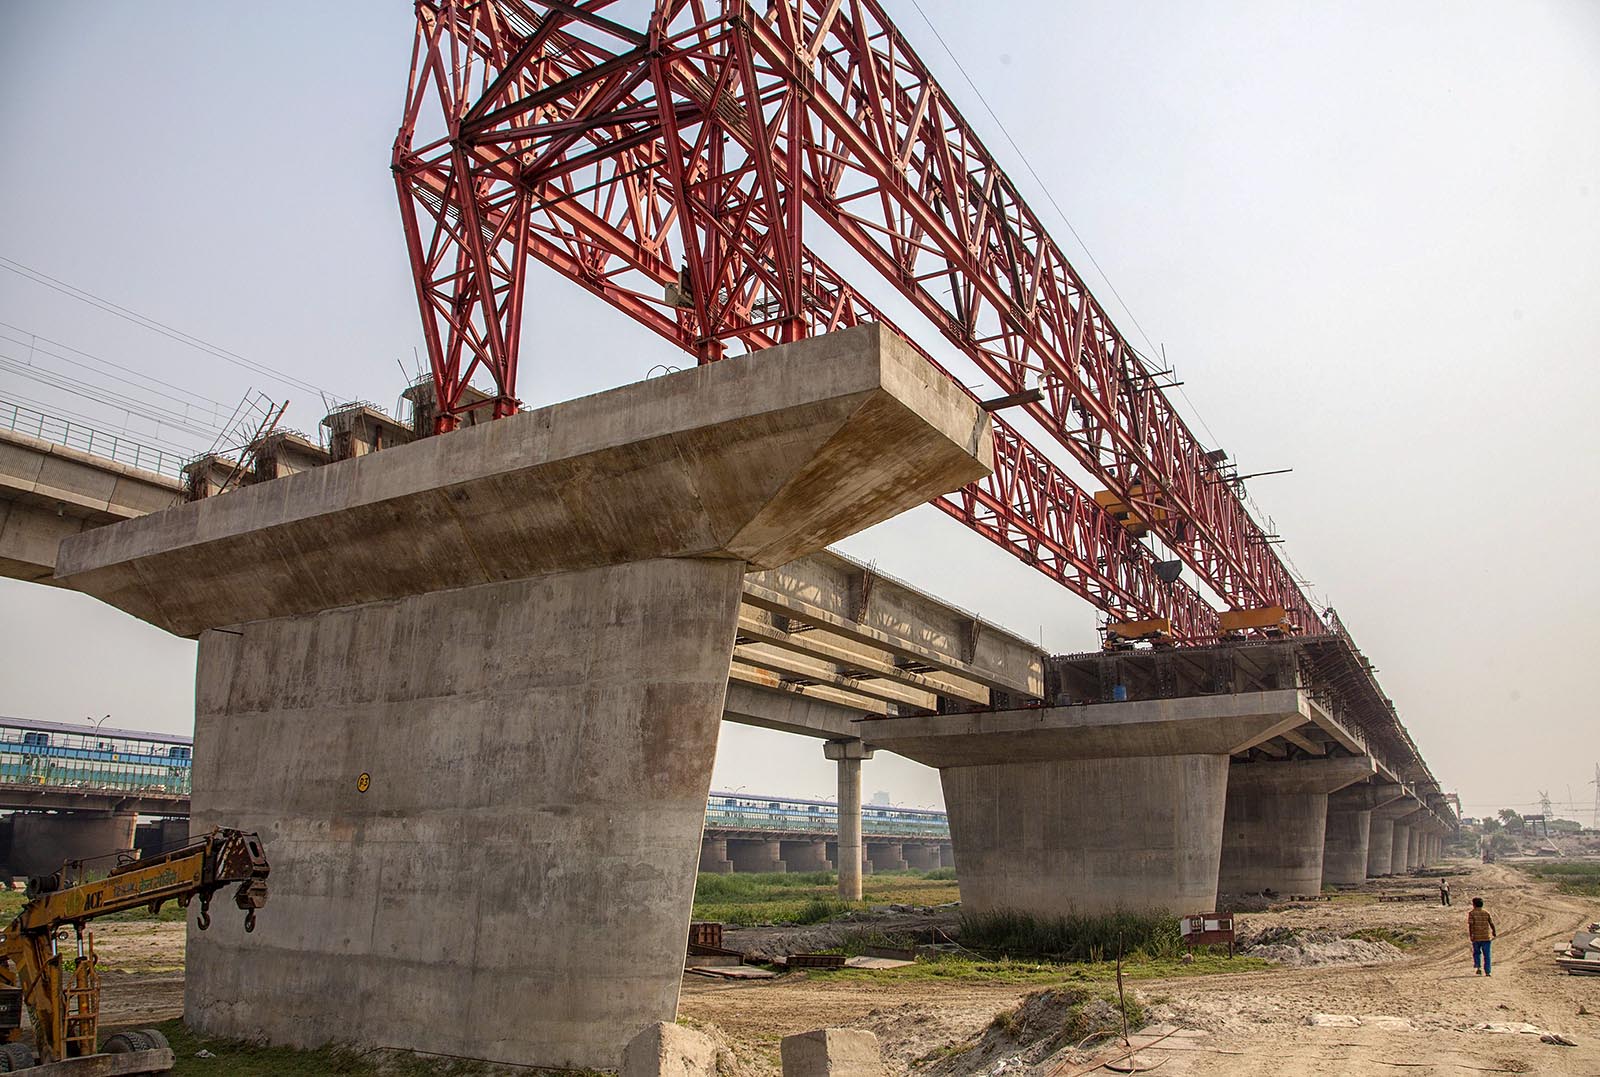
A man walks near a bridge under construction along the Yamuna river in New Delhi, India. Infrastructure investment will have to increase to accommodate a growing global population.
Photo: Noemi Cassanelli/AFP/Getty Images
With the global population expected to increase by nearly 2 billion people in the coming decades, infrastructure investment will reach $94 trillion, according to the World Bank. However, the bank predicts an $18 trillion shortfall in reaching that goal.
Fortunately, a new analysis of infrastructure bonds over 25 years from S&P Global reveals that infrastructure bonds receive higher credit ratings, exhibit lower volatility, and experience fewer defaults than other bonds issued by nonfinancial corporations. The data could encourage greater investor interest in infrastructure as an asset class.
A Big Investment Opportunity
The number of infrastructure projects rated by S&P Global has more than tripled over the last 25 years, to more than 1,400 issues by the end of 2016, the most recent year for which data is available.
The geographical base of these projects has also expanded: North America represented 96 percent of S&P’s infrastructure credits in 1991 and now represents just 53 percent. Europe, the Middle East and Africa jumped from 3 percent to 28 percent.
Overall, three-quarters of infrastructure projects were rated investment grade in 2016, compared to just 40 percent of nonfinancial corporations (Exhibit 1).
Exhibit 1: Higher Ratings for Infrastructure Projects

Utilities and Power Do Best
“Project finance” infrastructure projects received relatively lower ratings than traditional corporate infrastructure projects. These projects have also defaulted at a higher rate over the past 25 years. In project finance, project debt is off-loaded to a special purpose vehicle company. These projects typically involve more leverage than traditional corporate infrastructure.
Utilities, power, and oil and gas accounted for 84 percent of the studied projects. Other categories include transportation, such as toll roads, and “social infrastructure,” such as hospitals or public housing. Purely public finance was not included in the analysis.
Generally, utilities and social infrastructure projects received higher ratings than power and oil and gas. “Regulated utilities benefit from being essential services with high barriers to entry, often operating as natural monopolies, and a limited ability to add debt,” S&P Global notes.
Exhibit 2: Utilities, Social Infrastructure Receive High Ratings

Strong Performance During Recessions
Infrastructure defaults increased during the recessions of 1990-1991 and 2000, but the projects made it through the financial crisis “relatively unscathed,” S&P Global notes.
Exhibit 3: Default Rates Over 25 Years

Some countries saw a higher proportion of defaults. Argentina did particularly poorly, with 8 percent of defaults over the past 25 years, but just 1 percent of ratings in 2016. Canada and the UK, by contrast, had relatively few defaults.
Exhibit 4: Defaults by Region

Infrastructure projects perform better than nonfinancial corporate bonds in several ways, S&P Global says. They experience fewer defaults overall and also default less often than other bonds with the same ratings. Their ratings are also less likely to change with changes in economic cycles.
Downgrades
That said, infrastructure has seen periods of rating volatility. Downgrades were more common during a period of energy deregulation around 2001-2003 and, more recently, since mid-2014. This latter wave of downgrades is largely due to falling global oil prices and falling electricity prices in the U.S. resulting from the shale gas boom.
Exhibit 5: Rating Changes by Sector

Even when defaults occur, bondholders of infrastructure projects tend to recover a greater proportion of their investment than other bondholders. Overall, more than 40 percent of defaulted infrastructure debt instruments received “par,” i.e., initial value or greater, compared to fewer than 30 percent of nonfinancial debt instruments.
Exhibit 6: Better Recovery Rates for Infrastructure

Utilities showed particularly high recovery rates. “With essential assets and as providers of essential services, such as power, water, and gas,” S&P Global says, “utilities often have little or no practical substitute.”
Data “keeps the virtuous cycle spinning,” wrote Mar Beltran, senior director and infrastructure lead, EMEA, at S&P Global Ratings, in response to the analysis. “It gives greater confidence to infrastructure investors and can help maintain interest in the sector—and not only in North America, which had been the dominant destination of investment in the early 1990s. Now we see a diverse market, with investments reaching four corners of the globe. And this may prompt a similar response from issuers and investors alike: ‘Long may it last.’”