Global Insurance Prices Rise for Third Consecutive Quarter

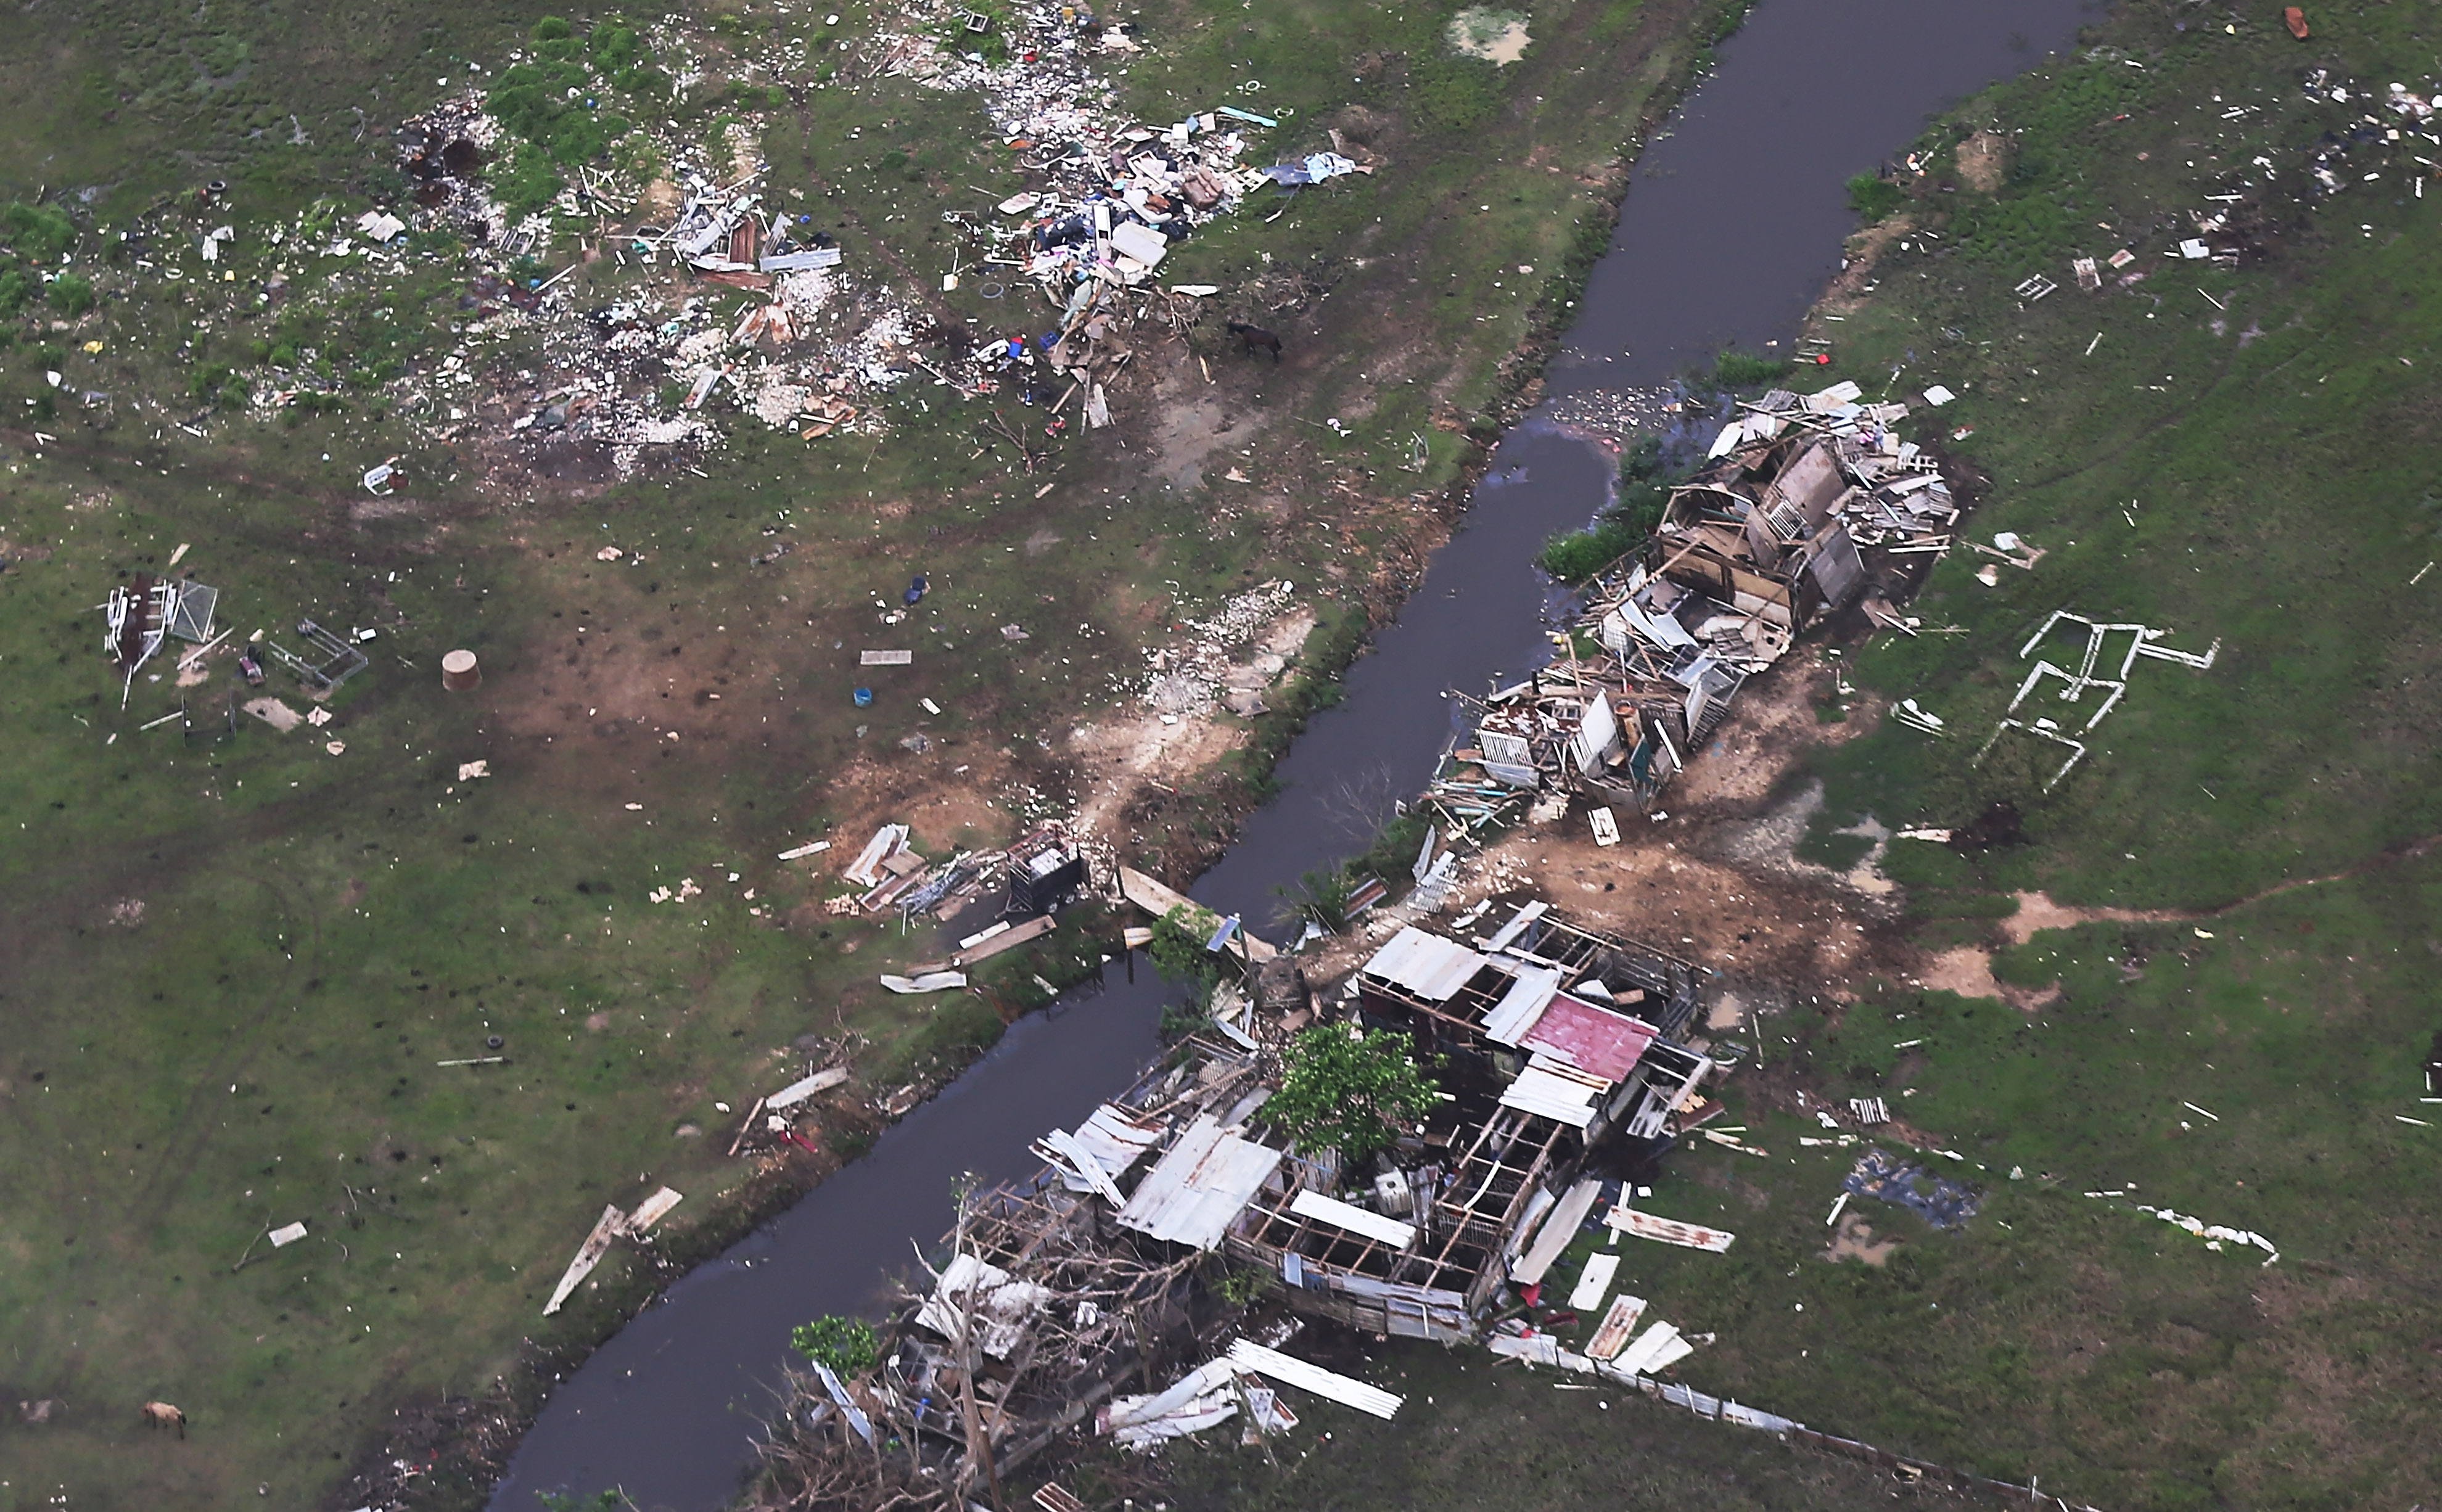
Destroyed buildings are viewed from the air during recovery efforts four weeks after Hurricane Maria struck Puerto Rico in 2017. Catastrophe events of last year have impacted pricing as carriers react to increases in claim notices and indemnity costs.
Photo: Mario Tama/Getty Images
Global commercial insurance prices rose, on average, in the second quarter of 2018, marking a third consecutive quarter of increases, according to the most recent Marsh Global Insurance Market Index. The increase in the index was driven largely by pricing for property and financial and professional insurance lines.
Overall, the insurance market remained fairly stable, with relatively narrow price changes across most product lines and in most regions. In the U.S., overall insurance pricing remained flat in the quarter; the UK showed a 0.8 percent increase; while in Continental Europe pricing declined 1.5 percent. Australia, once again, had the largest increases in both the index (up 13 percent) and in individual coverage lines.
Increases in Directors and Officers Insurance Drive Financial and Professional Lines Pricing
Financial and professional lines pricing continued to accelerate, increasing 3.3 percent on average, outpacing the rise in property pricing, which increased 2.3 percent. This was the third consecutive quarter in which global financial and professional lines pricing increased. Conversely, global casualty pricing decreased 1.4 percent in the quarter, a trend that has continued for several years.
In the U.S., average pricing in financial and professional lines increased after being flat in the first quarter. Much of the increase was centered on D&O liability coverage for public companies, with more than 30 percent of these firms experiencing a price increase on their renewing policies in the second quarter. D&O pricing increases were driven by poor underwriting results that, according to Fitch Ratings, were the worst since 2011. Among the emerging risk areas for D&O exposures are cyber risks and employment practices.
In the UK, as in the first quarter, financial and professional lines were the only major coverage area to show an increase (up 5 percent, on average). The increase in pricing in the UK was impacted by several factors, including adverse claims experience on technology-related E&O and cyber risks and an increase in the frequency and severity of securities claims and regulatory proceedings on D&O matters. U.S. exposed/listed risks are seeing the largest increases, specifically those in the pharmaceutical, technology, energy, and mining sectors. Professional indemnity has also seen some increased pricing due to losses/reserve adjustments in the design and construction market.
In Australia, average financial and professional liability pricing rose significantly in the second quarter, with the largest pricing increases observed on D&O coverages. Following several large losses and an ongoing Royal Commission review, financial institutions pricing also saw significant pricing increases (20 percent to 25 percent). Financial and professional lines have now increased, on average, for two years in the region.
Asia and Continental Europe were the only regions to show a pricing decrease in financial and professional liability, with prices declining 0.5 percent and 2.2 percent on average, respectively.
Property Pricing Continues To Be Affected by 2017 Catastrophes
Global pricing for property risks increased 2.3 percent on average, lower than the previous two quarters, which saw increases of 2.7 percent and 3.2 percent, respectively. The catastrophe events of 2017 continued to impact pricing as carriers reacted to the resulting increases in claim notices and indemnity costs. In some markets, for example, Australia, where pricing increased more than 12 percent, there is evidence of reduced capacity as some carriers have begun to adjust their underwriting appetite.
Property pricing showed variability by geography and risk class. The increase in pricing observed in the U.S. and Australia was offset by pricing declines in the UK, Continental Europe, Latin America, and Asia. Similarly, catastrophe-exposed risks are generally seeing pricing increases several percentage points higher than non-CAT risks.
Australia Sees Highest Increases of Any Region
The composite pricing index for Australia rose 13.7 percent, its sixth consecutive quarterly increase. All major product lines in Australia had an average pricing increase, led by financial and professional liability pricing (up more than 20 percent on average).
There has been a high level of activity related to securities class actions and several high-profile cases in Australia that date back to 2016 that have served to increase pricing. Some insurers are adjusting to the changing claims environment by moving significantly higher in the risk tower, effectively exiting the primary (or lower layers) marketplace.
Other regional highlights in the second quarter include:
- Cyber insurance prices in the U.S. increased, on average, 2.1 percent—the third time in the last eight quarters that rates have increased. The increase was driven by a minority of clients; however, many of these clients received double-digit price hikes as risk exposures increased and/or they bought higher limits. U.S. cyber continues to be an evolving market, with increased competition amongst insurers in all revenue segments and industries, partially offsetting clients’ increased demand for the product.
- In Continental Europe, competition is generally driving pricing decreases, especially for high-quality risks. Pricing reductions were typically modest for most businesses.
- In Latin America, casualty renewal pricing increased, on average, for the eighth quarter in a row, although the rate of increase moderated. Casualty line increases were tied primarily to auto rate corrections in most countries across the region.
- In Asia, the overall average pricing continues to decline, albeit at a slower pace. Singapore reported average pricing increases across all casualty and financial and professional liability product lines.
- In the UK, property pricing decreased for the second consecutive quarter, although last year’s catastrophe losses continue to temper the reduction, particularly for large, global organizations.
For more details on commercial insurance markets in the U.S., UK, Continental Europe, Latin America, Asia, and Australia regions, see Marsh’s full report online.


